Talk:Logistic distribution
I'm having trouble with the images, the density function one in particular.

 | This article is rated C-class on Wikipedia's content assessment scale. It is of interest to the following WikiProjects: | ||||||||||||||||||||
| |||||||||||||||||||||


Images
I'm having trouble with the images, the density function one in particular.
It appears the expression as it appears in the article is not what was plotted for the images; it would help tremendously if someone could put up a working image, or just explain what the difference is.
Otherwise, I'll take out the images for now?
RandomP 20:02, 16 June 2006 (UTC)
Okay, the image has been fixed in the commons. I'd taken it out for the intervening period, and Carbonate (talk · contribs) put it back in after it was fixed (though, er, I'm not making sense of his edit summary). Everything's okay then.
RandomP 14:02, 18 June 2006 (UTC)
The legends in the graph are confusing. I read this as "mu = 2s = 1", i.e. s=0.5, and I was wondering why the graphs didn't match mine. I had to look at the gnuplot code to figure this out. I don't have gnuplot, but if someone could simply write "mu = 2, s=1", then that would address the confusion. Thanks. Davidswelt (talk) 21:41, 4 February 2009 (UTC)
Applications
How about something on what applications are? For intance, it is used in the Elo rating system for chess players. RJFJR 18:10, 16 October 2007 (UTC)
I agree, addition of applications is absolutely essential to the content of this page. In particular, I think it ought to be mentioned where these distributions tend to occur in nature, and what causes things to follow such a distribution. Cazort 17:11, 1 November 2007 (UTC)
Generalized log-logistic distribution
I've just removed this section because:
- It doesn't really belong here as its a different distribution and needs a separate page
- It doesn't give any references
and i don't think the formulae are correct as they are incompatible with the log-logistic distribution (i.e. there is no value of the parameters for which the given formulae reduce to the form of the log-logistic distribution) - Googling Generalized log-logistic distribution gives several different forms (unfortunately there's always more than one way of generalizing something) but none appear the same as that given.
I've archived the content at a subpage /Generalized log-logistic distribution so if you disagree you can reinstate it if you can give a citation to a reference.--Qwfp (talk) 22:25, 31 January 2008 (UTC)
- I've just merged this into log-logistic distribution as a new section log-logistic distribution#shifted log-logistic distribution. On further investigation it turns out there are a number of different distributions sometimes known as the generalized log-logistic. The alternative name "shifted log-logistic" which is sometimes used is more descriptive and less ambiguous. The formulae were correct and it does reduce to the log-logistic for certain combinations of the parameters (so struck out some of my comment above), it's just a bit more complicated than you might expect. It could be a separate article, but its so closely related to the log-logistic that it seems better this way. --Qwfp (talk) 17:56, 15 February 2008 (UTC)
Characteristic function
Is the restriction given for the range of "t" correct here. I don't think you can just substitute "it" for "t" in the range required for the MGF, where "t" is implicitly real. Melcombe (talk) 17:49, 13 March 2008 (UTC)
Plain-language explanation, please?
Could someone please add plain-English explanations of the functions, their derivations, etc., so that people who don't know the meaning of the symbols and terminology can have some idea what is going on? As the article is written, the only people who can comprehend it (or at least the vast majority of the people who can comprehend it) are already familiar with the concept and therefore don't need the article in the first place. —Preceding unsigned comment added by 66.171.231.226 (talk) 01:55, 4 September 2009 (UTC)
- Sorry, but I don't really know what you're after. It's not really feasible to define mathematical concepts or do mathematical derivations without using mathematical notation rather than plain-English I'm afraid. This is a reference page about one of the less-common probability distributions, so it seems reasonable to assume some knowledge of probability theory and the maths that goes with it. The page on the normal distribution assumes less (and is far longer) as that's the most common probability distribution. From a quick review of this article, the main flaw I see is with the "Applications" section (which I may have a go at improving), as it seems to confuse the logistic distribution with the logistic function, which is related but not the same, and that article requires less background knowledge. Possibly that's what you were looking for?? (Apologies if not.) Regards, Qwfp (talk) 09:15, 4 September 2009 (UTC)
Related Distributions
There is an inconstency: In the Generalized Extreme Value article, it is said that if X ~ Gumbel(mu,sigma) then X ~ GEV(mu,sigma,0) so we do not need to write GEV two times. It seems that the current author thinks that Gumbel(mu,sigma) is a shifted version of GEV(mu,sigma,0), but this is not true on the respective [GEV] and [Gumbel] articles.
Consistent notation
Top of the article uses (mu, s) parameterization. Relation to other distributions is helpful, but begins from "Logistic(mu,beta)" using different parameters (mu, beta). It's not obvious what the relation is. 76.210.69.136 (talk) 04:38, 7 April 2011 (UTC)
Criticism
The section "Criticism" containing the following comment of William Feller was removed from the article page and pasted here on the talk page. The way people use the logistic distribution is a different thing from the distribution itself. In fact, this holds for all probability distributions. Asitgoes (talk) 08:10, 20 July 2013 (UTC)
- William Feller criticized overuse of the distribution:
The logistic distribution function
(4.10)
may serve as a warning. An unbelievably huge literature tried to establish a transcendental "law of logistic growth"; measured in appropriate units, practically all growth processes were supposed to be represented by a function of the form (4.10) with t representing time. Lengthy tables, complete with chi-square tests, supported this thesis for human populations, for bacterial colonies, development of railroads, etc. Both height and weight of plants and animals were found to follow the logistic law even though it is theoretically clear that these two variables cannot be subject to the same distribution. Laboratory experiments on bacteria showed that not even systematic disturbances can produce other results. Population theory relied on logistic extrapolations (even though they were demonstrably unreliable). The only trouble with the theory is that not only the logistic distribution but also the normal, the Cauchy, and other distributions can be fitted to the same material with the same or better goodness of fit. In this competition the logistic distribution plays no distinguished role whatever; most contradictory theoretical models can be supported by the same observational material. Reference: William Feller, An Introduction to Probability Theory and Its Applications, Vol. II, 2nd ed. (New York: John Wiley & Sons, 1971), 52-53.

Logistic distribution versus logistic function
User ZickZack made this edit with which he deleted various examples of application of the logistic distribution claiming that they did not relate to the logistic distribution but to the logistic function. However the logistic function is also a logistic distribution.
The CDF of the logistic distribution is defined as:
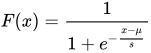
and that of the logistic function as:
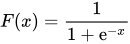
which is a particular case of the distribution namely for =0 and =1
This raises the following questions:


- 1 - Are all the examples of applications removed by ZicZack of the particular case?
- If yes, should they not have been moved to the logistic function article instead of simply deleting them?
- If no, should the deletions not be undone?
- 2 - Would it be better to merge the logistic function article with the logistic distribution page?
- If no, would it not be advisable to mention the relation between the logistic distribution and the logistic function in the introductory sections of both articles?
Asitgoes (talk) 09:14, 20 July 2013 (UTC)
- The Logistic Function is not a distribution. A function is not a distribution. That does not make sense. What you mean is that the Logistic Distribution has the the Logistic Function as a cumulative density function. That is something different. And it is the Logistic Function that has been used to model growth processes, not the Logistic Distribution. As for examples relating to the Logistic Function, I would discuss that over there on the relevant talk page. -- Zz (talk) 11:40, 22 July 2013 (UTC)
- @Zickzack: There is no such thing as a "cumulative density function". There is such a thing as a probability density function and as a cumulative distribution function. But "cumulative" obviously contradicts "density". Michael Hardy (talk) 15:17, 23 December 2019 (UTC)
- Can the logistic function be seen as the CDF (=cumulative distribution function) of the "standard" logistic distribution, i.e. the logistic distribution with =0 and =1 in similarity to the standard normal distribution being the normal distribution with =0 and =1? If yes, the function can be used for the distribution. Else (if no): why not? Asitgoes (talk) 16:03, 22 July 2013 (UTC)
- A distribution is not a function, so simple. The logistic function describes how the distribution looks like, but it does not make a distribution a function. So simple. Similarly, the logistic distribution cannot be used to model growth, because growth is not a distribution. -- Zz (talk) 09:45, 24 July 2013 (UTC)

Wrong pdf formula
Hi, I noticed that the pdf was shown in the article like this:
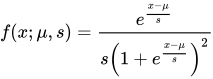
However, below the plotted images, the pdf is shown like this:
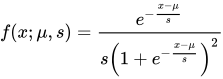
Notice the minus signs in both exponents of e. Other sources also indicate the second formula is the right one (for example: http://mathworld.wolfram.com/LogisticDistribution.html).
I have no knowledge of the subject, but this seemed like an error to me. I have now edited this, but I wanted to mention my edit here in case I'm wrong so someone with more knowledge could maybe see it.
EDIT: I have searched somewhat more and I found different sources using either the first or the second formula.
Sources that use the second form:
- http://mathworld.wolfram.com/LogisticDistribution.html
- http://www.boost.org/doc/libs/1_63_0/libs/math/doc/html/math_toolkit/dist_ref/dists/logistic_dist.html
- http://www.statisticshowto.com/logistic-distribution/
- http://keisan.casio.com/exec/system/1180573207
- http://pj.freefaculty.org/guides/stat/Distributions/DistributionWriteups/Logistic/Logistic-01.pdf
- http://www.mathwave.com/help/easyfit/html/analyses/distributions/logistic.html
- ...
Sources that use the first form:
- https://au.mathworks.com/help/stats/logistic-distribution.html (someone else mentioned this link in a previous edit of the article on 11 November 2016, before this edit the formula used was the second one)
- http://www.math.uah.edu/stat/special/Logistic.html
- http://reliawiki.org/index.php/The_Logistic_Distribution
- http://www.weibull.com/hotwire/issue56/relbasics56.htm
- ...
(All sources are found using the Google search engine)
— Preceding unsigned comment added by 2A02:1812:143E:F00:B846:3BEF:E6C1:4CA6 (talk) 01:39, 20 January 2017 (UTC)
Logistic vs normal distribution
Can we add a diagram like the last one in this page https://www.johndcook.com/blog/2010/05/18/normal-approximation-to-logistic/ comparing the shapes of the two distributions? --وسام زقوت (talk) 08:32, 31 October 2017 (UTC)
general comment
It was very hard to understand this article AltoStev Talk 17:36, 20 August 2021 (UTC)
- It is now merely somewhat difficult, but someone looking at this for the first time would definitely be quite confused.
- (I only came back to the talk to say I couldn't find any notation for the logistic distribution, which is unfortunate because it would be nice to describe it in a similar way to the normal distribution N(mu, sigma)) AltoStev (talk) 16:22, 18 April 2024 (UTC)
Content Disclaimer
Informasi ini disarikan dari Wikipedia dan disajikan kembali untuk tujuan edukasi. Konten tersedia di bawah lisensi CC BY-SA 3.0. Kami tidak bertanggung jawab atas ketidakakuratan data yang bersumber dari kontribusi publik tersebut.
- The information displayed on this website is sourced in part or in whole from Wikipedia and has been adapted for the purpose of restating it. We strive to provide accurate and relevant information, however:
- There is no guarantee of absolute accuracy. Wikipedia is an open, collaborative project that can be edited by anyone, so information is subject to change.
- It is not intended to constitute professional advice. The content displayed is for informational and educational purposes only. For important decisions (e.g., medical, legal, or financial), please consult a professional.
- Content copyright. Wikipedia is licensed under the Creative Commons Attribution-ShareAlike License (CC BY-SA). This means that content may be reused with appropriate attribution and shared under a similar license.
- Responsible use. Any risk arising from the use of information from this website is entirely the responsibility of the user.