User:Protonk/SWtest
Find sources: Google (books · news · scholar · free images · WP refs) · FENS · JSTOR · TWL Easy tools: Citat

 | This is not a Wikipedia article: It is an individual user's work-in-progress page, and may be incomplete and/or unreliable. Find sources: Google (books · news · scholar · free images · WP refs) · FENS · JSTOR · TWL |
In statistics, the Shapiro–Wilk test tests the null hypothesis that a sample x1, ..., xn came from a normally distributed population. It was published in 1965 by Samuel Shapiro and Martin Wilk.[1]
The test statistic is:
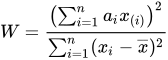
where
- x(i) (with parentheses enclosing the subscript index i) is the ith order statistic, i.e., the ith-smallest number in the sample;
- x = (x1 + ... + xn) / n is the sample mean;
- the constants ai are given by[2]

- where

- and m1, ..., mn are the expected values of the order statistics of independent and identically-distributed random variables sampled from the standard normal distribution, and V is the covariance matrix of those order statistics.
The user may reject the null hypothesis if W is too small.[3]
It can be interpreted via a Q-Q plot.
Interpretation
Recalling that the null hypothesis is that the population is normally distributed, if the p-value is less than the chosen alpha level, then the null hypothesis is rejected (i.e. one concludes the data are not from a normally distributed population). If the p-value is greater than the chosen alpha level, then one does not reject the null hypothesis that the data came from a normally distributed population. E.g. for an alpha level of 0.05, a data set with a p-value of 0.32 does not result in rejection of the hypothesis that the data are from a normally distributed population.[1]
See also
- Anderson–Darling test
- Kolmogorov–Smirnov test
- Cramér–von Mises criterion
- Normal probability plot
- Q-Q plot
References
- ^ Shapiro, S. S.; Wilk, M. B. (1965). "An analysis of variance test for normality (complete samples)". Biometrika. 52 (3–4): 591–611. doi:10.1093/biomet/52.3-4.591. JSTOR 2333709. MR 0205384.
- ^ op cit p. 593
- ^ op cit p. 605
- Razali, Nornadiah Mohd (2011). "Power comparisons of Shapiro-Wilk, Kolmogorov-Smirnov, Lilliefors and Anderson-Darling tests". Journal of Statistical Modeling and Analytics. 2 (1): 21–33.
{{cite journal}}: Unknown parameter|coauthors=ignored (|author=suggested) (help) - Rowston, Patrick (1982). "An extension of Shapiro and Wilk's W test for normality to large samples". Applied Statistics (31): 115–124. doi:10.2307/2347973. JSTOR 2347973.
- Rowston, Patrick (1982). "Algorithm AS 181: The W test for Normality". Applied Statistics (31): 176–180. doi:10.2307/2347986. JSTOR 2347986.
- Rowston, Patrick (1995). "AS R94: A remark on Algorithm AS 181: The W test for normality". Applied Statistics (44): 547–551. doi:10.2307/2986146. JSTOR 2986146.
- Shapiro, S. S. (1968). "A Comparative Study of Various Tests for Normality". Journal of the American Statistical Association. 63 (324): 1343–1372. doi:10.1080/01621459.1968.10480932.
{{cite journal}}: Unknown parameter|coauthors=ignored (|author=suggested) (help) - Chen, Edwin H. (1971). "The Power of the Shapiro-Wilk W Test for Normality in Samples from Contaminated Normal Distributions". Journal of the American Statistical Association. 66 (336): 760–762.
- Leslie, J. R. (1986). "Asymptotic Distribution of the Shapiro-Wilk W for Testing for Normality". The Annals of Statistics. 14 (4): 1497–1506. doi:10.1214/aos/1176350172.
{{cite journal}}: Unknown parameter|coauthors=ignored (|author=suggested) (help)
Content Disclaimer
Informasi ini disarikan dari Wikipedia dan disajikan kembali untuk tujuan edukasi. Konten tersedia di bawah lisensi CC BY-SA 3.0. Kami tidak bertanggung jawab atas ketidakakuratan data yang bersumber dari kontribusi publik tersebut.
- The information displayed on this website is sourced in part or in whole from Wikipedia and has been adapted for the purpose of restating it. We strive to provide accurate and relevant information, however:
- There is no guarantee of absolute accuracy. Wikipedia is an open, collaborative project that can be edited by anyone, so information is subject to change.
- It is not intended to constitute professional advice. The content displayed is for informational and educational purposes only. For important decisions (e.g., medical, legal, or financial), please consult a professional.
- Content copyright. Wikipedia is licensed under the Creative Commons Attribution-ShareAlike License (CC BY-SA). This means that content may be reused with appropriate attribution and shared under a similar license.
- Responsible use. Any risk arising from the use of information from this website is entirely the responsibility of the user.