Talk:Population proportion
Peer Review: First off your opening paragraph is incredible and I think the examples are perfect in explaining every aspect. The first thing I noticed was there

 | This article is rated Start-class on Wikipedia's content assessment scale. It is of interest to the following WikiProjects: | ||||||||||
| |||||||||||

Untitled
Peer Review: First off your opening paragraph is incredible and I think the examples are perfect in explaining every aspect. The first thing I noticed was there is no founder. I recommend looking into that a little bit and if there is no clear founder describe that and explain when it was founded if that kind of information is available. I like the use of the equations for each part and the explanation of what each variable is for. I'm not entirely sure what a lot of the things meant since I'm not that mathematical. It all sounded really good and again I really think the examples are very well done and they help explain each part in common terms. The only thing I think could be added is an info box with a simple overview. — Preceding unsigned comment added by Kretscht (talk • contribs) 21:26, 28 March 2016 (UTC)
Wiki Education Foundation-supported course assignment
 This article is or was the subject of a Wiki Education Foundation-supported course assignment. Further details are available on the course page. Peer reviewers: Kretscht, Loganmaggart.
Above undated message substituted from Template:Dashboard.wikiedu.org assignment by PrimeBOT (talk) 02:33, 18 January 2022 (UTC)
help needed about "Common errors"
The current section titled Common errors and misinterpretations from estimation is a good topic to cover, but I think its current contents don't make sense, and I would delete the section if it cannot be improved. The section reads:
A very common error that arises from the construction of a confidence interval is the belief that the level of confidence such as means 95% chance. This is incorrect. The level of confidence is based on a measure of certainty, not probability. Hence, the values of fall between 0 and 1, exclusively.


I don't get what distinction is being made, and I don't think the average reader will either. "There is a 95% chance that the true proportion is in this range" vs. "There is 95% probability" vs. "There is 95% certainty" all mean the same thing. I would avoid the latter because "certainty" is 100% and doesn't lend itself to being qualified, but here the term "certainty" is actually being recommended. --doncram 17:31, 17 May 2017 (UTC)
- @Doncram: I agree that the sentence was not easily comprehensible. The correct interpretation of a confidence interval is that in the long run, for every 100 independent experiments we perform of exactly the same nature, exactly 95% will cover the population proportion. What is not correct is to state that the population proportion has a 95% probability of falling in the confidence interval; this confounds confidence intervals with the similar but distinct notion of credible intervals, where the population proportion is treated as a random variable. In confidence intervals, the population proportion is not a random variable, and therefore cannot have a certain probability of being at a certain value; it either has that value, or it doesn't. Kayau (talk · contribs) 07:56, 4 July 2017 (UTC)

Sample size
1. In addition to, or instead of, stating that the normality assumption is met if and (where is the sample size of a given random sample and is its sample proportion), how about just provide a table or a plot of the relationship?

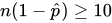


p-hat   N sufficient
.05       200
.1        100
.2        50
.3333     30
.5        20
.6667     30
.8        50
.9        100
.95       200
2. Can't we reason without the normality assumption? Then wouldn't it be better to provide some table that provides guidance without requiring a normal approximation to be met. --doncram 17:45, 17 May 2017 (UTC)
- @Doncram: Yes; see Clopper-Pearson interval and the related intervals on that page, for example. Kayau (talk · contribs) 08:00, 4 July 2017 (UTC)
Conditions for inference
The conditions for inference do not make sense to me. For example, the article currently states:
- Let be the size of the population of interest and let be the sample size of a simple random sample of the population. If , then the data's individual observations are independent of each other.


Independence depends on how the samples have been chosen, not the sample size. It is certainly possible to have a large sample that was chosen in a independent way, and a small sample that is biased. On the other hand, the article claims that if less than 10% of the population is sampled, the sample will be independent. This seems wrong.
Content Disclaimer
Informasi ini disarikan dari Wikipedia dan disajikan kembali untuk tujuan edukasi. Konten tersedia di bawah lisensi CC BY-SA 3.0. Kami tidak bertanggung jawab atas ketidakakuratan data yang bersumber dari kontribusi publik tersebut.
- The information displayed on this website is sourced in part or in whole from Wikipedia and has been adapted for the purpose of restating it. We strive to provide accurate and relevant information, however:
- There is no guarantee of absolute accuracy. Wikipedia is an open, collaborative project that can be edited by anyone, so information is subject to change.
- It is not intended to constitute professional advice. The content displayed is for informational and educational purposes only. For important decisions (e.g., medical, legal, or financial), please consult a professional.
- Content copyright. Wikipedia is licensed under the Creative Commons Attribution-ShareAlike License (CC BY-SA). This means that content may be reused with appropriate attribution and shared under a similar license.
- Responsible use. Any risk arising from the use of information from this website is entirely the responsibility of the user.