Talk:Average

 | The content of Central tendency was merged into Average on 25 July 2026. The former page's history now serves to provide attribution for that content in the latter page, and it must not be deleted as long as the latter page exists. For the discussion at that location, see its talk page. |
| The content of Mean was merged into Average on 25 July 2026. The former page's history now serves to provide attribution for that content in the latter page, and it must not be deleted as long as the latter page exists. For the discussion at that location, see its talk page. |
| This is the talk page for discussing improvements to the Average article. This is not a forum for general discussion of the subject of the article. |
Article policies
|
| Find sources: Google (books · news · scholar · free images · WP refs) · FENS · JSTOR · TWL |
Archives: 1Auto-archiving period: 3 months  |
 | This  level-4 vital article is rated C-class on Wikipedia's content assessment scale. level-4 vital article is rated C-class on Wikipedia's content assessment scale.It is of interest to the following WikiProjects: | ||||||||||||||||||||
| |||||||||||||||||||||


Bats are not bugs
Please find me a common textbook that uses the word "average" to mean "median" or "mode". I don't think there is one. I propose to remove "median" and "mode" as possible meanings of "average" from this article. —Quantling (talk | contribs) 02:25, 6 February 2026 (UTC)
- While the arithmetic mean is indeed by far the most common meaning of "average", the other meanings are prevalent enough that they should be prominently mentioned. Otherwise, readers may be lead to misinterpret sources that use the word "average" without disambiguation to refer to the the harmonic mean (such as average speed) or the median (such as average income). I've added a bunch of citations to support this, and I can find more.
- As to your specific comments about textbooks:
- https://jse.amstat.org/v17n3/kaplan.pdf#page=6 states:
Introductory statistics textbooks tend to use the word average to describe the process of finding the mean of a data set (see for example, Moore (2007), Utts & Heckard, (2004), or Agresti & Franklin (2007)). The experience of one member of the research team, however, both as a teacher and a statistical consultant, shows that the word average is used in everyday language to have a variety of meanings that include what is "typical" and what is "normal". In addition, when used as a measure of center, many use average interchangeably with the ideas of "median" or even "mode".
- https://jse.amstat.org/v18n2/kaplan.pdf#page=7 (by the same authors) states:
Introductory statistics textbooks tend to use the word average to describe the process of finding the mean of a data set (see for example, Moore, 2007). Triola (2006), however, specifically addresses the concern that many people use average interchangeably with the ideas of "median" or even "mode" stating "the term average is sometimes used for any measure of center and is sometimes used for the mean" (pg. 81).
- Here, "Triola (2006)" refers to this textbook:
Triola, M. F. (2006). Elementary Statistics, 10th Edition. Boston, MA: Pearson Education, Inc.
- The 12th edition (2014) of this textbook, on p. 53, states:
The word average is often used for the mean, but it is sometimes used for other measures of center.
- Also, the Merriam-Webster dictionary defines "average" as:
a single value (such as a mean, mode, or median) that summarizes or represents the general significance of a set of unequal values
- Solomon Ucko (talk) 07:58, 6 February 2026 (UTC)
- Given that we agree about "by far the most common meaning", I'd be tempted to make "Average" be a disambiguation page. It would say something like:
- In mathematics, it means arithmetic mean (aka expected value), though occasionally it is instead used to mean other central values such as median, mode, geometric mean, or harmonic mean.
- Outside of mathematics, it can mean common, typical, or normal.
- I just put in arbitrary wikilinks there ... if they are disambiguation pages or otherwise inappropriate, we'd need to fix that. Assuming that we do, do you think a solution along those lines would work? —Quantling (talk | contribs) 17:47, 6 February 2026 (UTC)
- If these were unrelated things that just happened to have the same name, I think a disambiguation page would be needed, but because they are closely-related concepts that have a lot in common, I think the current structure is better, since it allows us to show the similarities and differences, when each specific sense is used, and the history behind the term.
- I think the lead already states most of what you proposed, just with more detail and explanation. The first paragraph even demonstrates how to compute the arithmetic mean, whereas the other averages only have a terse definition and a link to the full article, so this does appropriately give more weight to that meaning.
- I disagree with replacing the whole page, but I'd be fine with making adjustments to the wording (perhaps based on what you have here) and layout if you think that would make it clearer.
- Solomon Ucko (talk) 19:36, 6 February 2026 (UTC)
- Given that we agree about "by far the most common meaning", I'd be tempted to make "Average" be a disambiguation page. It would say something like:
- Here are some more textbooks that have definitions that aren't limited to arithmetic mean: (in arbitrary order)
- Fischer, Frederic E. (1973). Fundamental Statistical Concepts. San Francisco: Canfield Press, Harper & Row. ISBN 0-06-382662-3. LCCN 72-3309. OCLC 613512. pp. 18–20:
2.2 Measures of Central Location One important way of describing a set of sample data is to give some indication of "central location" (average) in the distribution of measurements. We shall discuss and compare three different measures of central location: the mean, the median, and the mode. [...] 2.2.1 The Sample Mean The sample mean is the statistic most commonly associated with the term "average." To find it we divide the sum of the measurements by the number of measurements. [...] 2.2.2 The Sample Median A second type of "average" is called the sample median. This statistic is a measure of central location in the sense that if you order the measurements according to size, there are just as many measurements below the median as above it. [...] Note that the mean and median are not equal in this example, even though both statistics attempt to measure central location. [...] 2.2.4 Mean, Median, and Mode — Advantages and Disadvantages We have observed that the "average" number of children per family can be expressed three ways: mean = 3.2, median = 3, and mode = 2. Each statistic has its advantages and disadvantages depending upon the situation and purpose of the investigation.
- Aitken, A. C. (1949). Statistical Mathematics. University Mathematical Texts (6th ed.). Edinburgh and London: Oliver and Boyd; New York: Interscience Publishers, Inc. OCLC 16936754. pp. 29–30:
14. Descriptive Parameters of Distribution [...] Typical Parameters or Averages. There are three of these in common use, the mode, the median and the arithmetic mean. [...] Arithmetic Mean. The most widely used typical measure is the arithmetic mean, which is simply the first moment or mathematical expectation of
- Witte, Robert S. (1980). Statistics. Holt, Rinehart and Winston. ISBN 0-03-055231-1. LCCN 78-57922. OCLC 6277785. pp. 35–43:
4 Describing Data with Averages There are three common averages: the most fashionable (mode), the middle (median), and the balance point (mean). [...] The type of average used depends on a number of factors, but mainly whether data are quantitative, qualitative, or ranked. [...] A well-chosen average consists of a single number (or word) about which the data are, in some sense, centered. Actually, even for a given set of data, there can be several different types of averages or, as they're sometimes called, measures of central tendency. This chapter describes how to calculate and how to interpret three commonly employed averages. [...] 4.3 Mean The mean is the most common average—one that doubtless you have calculated many times. It can be found by adding all observations, then dividing by the number of observations [...] 4.4 Which Average? When a distribution of observations is not too lopsided, the values of the mode, the median, and the mean are similar, and any of them may be used to describe the central tendency of the distribution. [...] 4.10 Using the Word "Average" Strictly speaking, an "average" could refer to the mode, median, or mean—or even to some more exotic average, such as the geometric mean or the harmonic mean. Conventional usage prescribes that "average" usually signifies "mean," and this connotation is often reinforced by the context. [...] Unless context and usage make it clear, however, it is a good policy to specify the particular average with which you are dealing, even at the cost of a slight explanation.
- Weiss, Neil A. (2005). Elementary Statistics (6th ed.). Pearson Addison Wesley. ISBN 0-201-77130-6. LCCN 2004044595. OCLC 54752815. pp. 92–94:
3.1 Measures of Center Descriptive measures that indicate where the center or most typical value of a data set lies are called measures of central tendency or, more simply, measures of center. Measures of center are often referred to as averages. In this section, we discuss the three most important measures of center: the mean, median, and mode. [...] The Mean The most commonly used measure of center is the mean. When people speak of taking an average, they are most often referring to the mean. Definition 3.1 Mean of a Data Set The mean of a data set is the sum of the observations divided by the number of observations. [...] The Median Another frequently used measure of center is the median. [...] The Mode The final measure of center that we discuss here is the mode.
- Rees, D. G. (1987). Foundations of Statistics. Science Paperbacks. Chapman and Hall. ISBN 0-412-28560-6. LCCN 87-15770. OCLC 16004535. pp. 15–28:
2 Measures of Location: 2.1 INTRODUCTION: We are all familiar with the term 'average'. This is a statistic which is an attempt to summarize a set of univariate (one variable) data by a single 'middle' value. For example, we might say 'the average age of students in our class is 16 years and 7 months'. Statisticians prefer to use the term 'measure of location' instead of 'average'. There are many different ways of defining such a measure. In this chapter we will consider the following measures of location: mean, median, mode, geometric mean, weighted mean (including index numbers) [...] 2.2. MEAN OF UNGROUPED DATA: The mean, or to be strictly accurate the arithmetic mean, is simply the total of a set of observations of a variable divided by the number of observations. [...] 2.8 WHEN TO USE THE MEAN, MEDIAN AND MODE: In order to decide which of the three measures of location to use in a particular case we need to consider the shape of the distribution [...] 2.9 GEOMETRIC MEAN, WEIGHTED MEAN AND INDEX NUMBERS: In certain special applications, measures of location other than those discussed so far in this chapter are employed. For example, if we measure a variable for an 'individual' and we have reason to believe that the value of the variable is increasing (or decreasing) at a rate proportional to its previous value then the geometric mean (GM) is used. [...] The weighted mean (WM) has an important application in the calculation of index numbers, which are of particular interest in business and finance. [...] 2.10 SUMMARY: A measure of location is an attempt to summarize a set of data with a single value.
- Kendall, Maurice; Stuart, Alan (1977). The Advanced Theory of Statistics. Vol. 1: Distribution Theory (4th ed.). Macmillan; Charles Griffin. ISBN 0-02-847630-1. LCCN 77-77590. OCLC 3330321. pp. 33–41:
CHAPTER 2 MEASURES OF LOCATION AND DISPERSION [...] Measures of location: the arithmetic mean 2.3 There are three groups of measures of location in common use: the means (arithmetic, geometric and harmonic), the median and the mode. We consider them in turn. The arithmetic mean is perhaps the most generally used statistical measure, and in fact is far older than the science of statistics itself. [...] The geometric mean and the harmonic mean 2.5 Two other types of mean are in use in elementary statistics, though they are of less importance in advanced theory. [...] The median 2.8 The median [*: The name "median" was first used by Galton in 1883, but the concept was used by him, and by Fechner independently, around 1870.] is that value of the variate which divides the total frequency into two equal halves [...] The mode 2.10 If the frequency function has a local maximum at a value , i.e. if is greater at than at neighbouring values below and above , there is said to be a mode of the distribution at . [...] 2.11 In a symmetric unimodal distribution the mean, the median and the mode coincide. [...] 2.12 Mention should also be made of a little-used measure of location, the mid-range.
- Hernon, Peter (1991). Statistics: A Component of the Research Process. Norwood, New Jersey: Ablex Publishing Corporation. ISBN 0-89391-759-1. LCCN 90-25781. OCLC 22889330. pp. 94–96:
AVERAGES There are three types of averages or measures of central tendency: the mode, median, and mean. Mode The mode, the point(s) at which the largest number of scores fall, indicates the most typical case. The mode is the least stable of the measures of central tendency. [...] Mean The mean is typically the measure of central tendency that people have in mind when they think of "the average." It is the sum of all the scores divided by the number of scores
- Ben-Zvi, Dani; Garfield, Joan, eds. (2004). The Challenge of Developing Statistical Literacy, Reasoning and Thinking. Kluwer Academic Publishers. OCLC 55208346. ISBN 1-4020-2277-8 (HB), ISBN 1-4020-2278-6 (e-book). — This one has a bunch of relevant stuff, so I'll go through it later. It looks like you should qualify for WP:The Wikipedia Library, which has access to this, if you'd like to read it yourself: https://link-springer-com.wikipedialibrary.idm.oclc.org/book/10.1007/1-4020-2278-6
- Fischer, Frederic E. (1973). Fundamental Statistical Concepts. San Francisco: Canfield Press, Harper & Row. ISBN 0-06-382662-3. LCCN 72-3309. OCLC 613512. pp. 18–20:
- I like your edit, BTW.
- Solomon Ucko (talk) 05:51, 10 February 2026 (UTC)
- P.S. Here are some more relevant quotes from textbooks:
- Spiegel, Murray R. (1988). (Schaum's Outline of) (Theory and Problems of) Statistics. Schaum's Outline Series (in Mathematics) (2nd ed.). McGraw-Hill. ISBN 0-07-060234-4. LCCN 88-26657. OCLC 18560515. pp. 58–65:
Chapter 3: The Mean, Median, Mode, and Other Measures of Central Tendency [...] AVERAGES, OR MEASURES OF CENTRAL TENDENCY An average is a value that is typical, or representative, of a set of data. Since such typical values tend to lie centrally within a set of data arranged according to magnitude, averages are also called measures of central tendency. Several types of averages can be defined, the most common being the arithmetic mean, the median, the mode, the geometric mean, and the harmonic mean. Each has advantages and disadvantages, depending on the data and the intended purpose. [...] THE EMPIRICAL RELATION BETWEEN THE MEAN, MEDIAN, AND MODE For unimodal frequency curves that are moderately skewed (asymmetrical), we have the empirical relation [...] THE ROOT MEAN SQUARE (RMS) The root mean square (RMS), or quadratic mean, [...] This type of average is frequently used in physical applications. [...] Frequently one uses the term average synonymously with arithmetic mean. Strictly speaking, however, this is incorrect since there are averages other than the arithmetic mean.
- Jaeger, Richard M. (1983). Statistics: A Spectator Sport. Sage Publications. ISBN 0-8039-2171-3. LCCN 83-17740. OCLC 9919300. pp. 43–53, 329–334:
2. Concepts Of Central Tendency Where is the Center? [...] One of the most elementary types of statistics indicates the location of the center of a score distribution. In many statistics texts, statistics that identify the center or middle of a set of scores are called measures of central tendency. [...] How to Define the Center The center of a score distribution can be defined in many different ways. However the most commonly used measures of central tendency are the mode, the median, and the mean. When used with a listing of scores, an ordered array, or an ungrouped frequency distribution (see Tables 1, 2 and 3 of Chapter 1), the mode is defined as the most frequently occurring score. In a grouped frequency distribution, the score class that has the highest frequency (biggest number) associated with it is called the modal interval. The mode is the score value that is right in the middle (the midpoint) of the modal interval). Many statistics texts use the symbol "Mo." to denote the mode. However, various authors use different symbols for the same statistics. A committee on statistical notation has existed within the American Statistical Association for over 30 years, and it's no closer to achieving consistent statistical notation than is the United Nations to bringing about world peace. [...] The most widely used measure of central tendency is the arithmetic mean. You have been computing means for years, and you probably just called them averages. [...] Which Measures When? Three factors should be considered when you try to decide whether an author has used the right measure of central tendency: (1) the level of measurement of the data, (2) the shape of the score distribution, and (3) the stability of the measure of central tendency. [...] If a distribution has only one peak and is not symmetric, the mean, median, and mode will all be different. If the score distribution is positively skewed, the mode will be smallest, the mean will be largest, and the median will be between the mode and the mean. [...] Of the three measures of central tendency, the mode is, by far, the least stable. [...] The mean is [] the most stable of these measures of central tendency. [...] Summary In this chapter we have tried to give you a sense of the meaning of three statistics that refer to "the center" of a score distribution. These measures of central tendency are defined differently, and will, therefore often differ from each other in value. Each of the statistics is a good measure of central tendency in some situations, and a bad measure in others. [...] Glossary [...] MEAN: This sample statistic or population parameter is the most frequently used indicator of the middle of a score distribution. Its other names are the "average" and the "arithmetic average." For a group of raw scores, it is found simply by summing the scores and dividing by the number of scores. [...] MEASURES OF CENTRAL TENDENCY: This generic term includes all sample statistics and population parameters that indicate where the middle of a score distribution falls. The most common measures of central tendency are the mean (or arithmetic average), the median, and the mode. These statistics and parameters tell us where the center of a distribution "tends to be." [...] MODE: The mode is sometimes an indicator of the middle of a score distribution, and is therefore classified as a measure of central tendency.
- Iversen, Gudmund R.; Gergen, Mary (1997). Statistics: The Conceptual Approach. Springer Undergraduate Textbooks in Statistics. Springer-Verlag. ISBN 0-387-94610-1. LCCN 96-23148. OCLC 34730152. SPIN 10491017. pp. 129–141:
4: DESCRIPTION OF DATA: COMPUTING SUMMARY STATISTICS Did Shakespeare write Shakespeare? How many children does the average American family have? Do men make more money than women? How many times per minute does the "normal" heart beat? [...] This chapter is concerned with two problems. 1. How to summarize many observations of a variable into a single number that gives us a central tendency, or average value. Is it possible to find a single value that illustrates what all the observations are like? [...] 4.1 AVERAGES: LET US COUNT THE WAYS {An average is a single number computed from the observed values of a variable.} The most common number computed from data is an average or central value of some kind. Most of us were introduced to the notion of averages in elementary school. Today, we read about the average salary of MBAs, average house prices, Dow Jones average stock prices, average homicide rates, and so on. But how aware are we of the various forms of averaging possible to us, or how simply calculating a particular average can create false impressions? There are many kinds of averages, not just one. To explore this variety, take a close look at the following sentence: "The average person in this country today is a woman who has 2.1 children and lives in a house worth $80,000." Three common kinds of average are referred to in that sentence. Can you distinguish how the three differ? Mode: The hostess with the mostes' [...] The statement that the average person in this country is a woman uses a statistical average called the mode. [...] Median: Counting to the middle Our "average" woman lives in a house valued at $80,000. "Average" house prices and many other economic variables are most often described by the median value. [...] Mean: Balancing the seesaw {The mean is the value of the variable obtained when the values of all the observations are added and the sum is divided by the number of observations.} When we say that the average American family has 2.1 children, we are saying that the mean number of children per family in the United States equals 2.1. The mean is the most commonly used type of average. Just like the median, the mean gives a value of the variable somewhere in the middle of the observed data. [...] Mode, Median, or Mean? We should get into the habit of asking ourselves which kind of average is being used in a data analysis and whether it is the right kind. Occasionally people use the wrong type of average on purpose to create an impression from the data that may not be fully warranted. When a distribution is skewed with many small observations and only a few large observations (the distribution of household income is an example), then the mean will be larger than the median. Anyone who wanted to summarize this distribution with as large a value as possible would then use the mean, even though the median would be a more appropriate choice of average. [...] 4.2 VARIETY: MEASURING THE SPICE OF LIFE Usually, an average is a useful way of summarizing data, but sometimes an average can be misleading. [...] any average masks the extreme values in a set of data, and extreme values are sometimes of particular interest. [...] In one data set, the observations are all close to each other, while in the other data set the observations are spread out. No average—mode, mean or median—would catch this crucial difference. In this case, the spread of the data needs to be taken into account.
- Weiss, Neil A.; Hassett, Matthew J. (1991). Introductory Statistics (3rd ed.). Addison-Wesley Publishing Company. ISBN 0-201-17833-8. LCCN 89-17663. OCLC 20130196. p. 70:
3.1: Measure of central tendency Descriptive measure that indicate where the center or most typical value of a set lies are called measure of central tendency, often more simply referred to as averages. In this section we will discuss the three most important measures of central tendency—the mean, the median, and the mode. THE MEAN The most commonly used measure of central tendency is the mean. When people speak of taking an average, it is the mean that they are most often referring to. [...] The mean of a data set is defined to be the sum of the data divided by the number of pieces of data
- Twaite, James A.; Monroe, Jane A. (1979). Introductory Statistics. Scott, Foresman and Company. ISBN 0-673-15097-6. OCLC 4194012. pp. 128–130:
4: Descriptive Statistics for Univariate Problems DESCRIPTIVE STATISTICS FOR UNIVARIATE PROBLEMS: AN OVERVIEW [...] When we are interested in describing the entire distribution of scores, there are two types of numerical indices that are especially useful. These are measures of central tendency and measures of variability. Measures of central tendency are numerical indices that attempt to answer the question "What is the typical score in this distribution of scores?" Measures of variability [...] When we are interested in describing the position of a particular score relative to the other scores in the distribution, we use numerical indices known as 'measures of location. Measures of location are also descriptive statistics, but they describe the position of one score relative to the others rather than describing the whole set of scores. Measures of Central Tendency There are several different measures of central tendency. You are probably already acquainted with the terms "mode," "median," and "mean." These are all measures of central tendency. Each is an indicator of what a typical score is, but each one employs a different definition of "typical." [...] Perhaps the most common way of thinking about the typical score in a distribution is to think about the average score. The mean of a distribution of scores is defined as the numerical average of all the scores in the distribution.
- Spiegelhalter, David (September 2019) [Originally published in March 2019 by Pelican, an imprint of Penguin Books, in the United Kingdom]. The Art Of Statistics: How To Learn From Data. Basic Books, an imprint of Perseus Books, LLC, a subsidiary of Hachette Book Group, Inc. ISBN 978-1-5416-1851-0. OCLC 1112668483. pp. 39–48:
CHAPTER 2 Summarizing and Communicating Numbers. Lots of Numbers [...] When a set of counts or continuous observations are reduced to a single summary statistic, this is what we generally call their average. We are all familiar with the idea of, for example, average wages, average exam grades and average temperatures, but it is often unclear how to interpret these figures (particularly if the person quoting these averages does not understand them). There are three basic interpretations of the term 'average', sometimes jokingly referred to by the single term 'mean-median-mode': * Mean: the sum of the numbers divided by the number of cases. [...] These are also known as measures of the location of the data distribution. [...] Unfortunately, when an 'average' is reported in the media, it is often unclear whether this should be interpreted as the mean or median. For example, the UK Office for National Statistics calculates Average Weakly Earnings, which is a mean, while also reporting median weekly earnings by local authority. In this case it might help to distinguish between 'average income' (mean) 'the income of the average person' (median). House prices have a very skewed distribution, with a long right-hand tail of high-end properties, which is why official house price indices are reported as medians. But these are generally reported as the 'average house price', which is a highly ambiguous term. Is this the average-house price (that is, the median)? Or the average house-price (that is, the mean)? A hyphen can make a big difference.
- Weldon, K. Laurence (1986). Statistics: A Conceptual Approach. Prentice-Hall, Inc. ISBN 0-13-845819-7. LCCN 85-9549. OCLC 12104394. 36-G-4100. pp. 91–94:
4.4: SUMMARY MEASURES: AVERAGE AND STANDARD DEVIATION The main purpose of this section is to discuss the most commonly used summary measures that describe a frequency distribution. We shall be especially concerned with summaries of the center and spread of a frequency distribution. [...] The average of a list of numbers is the sum of the numbers in the list divided by the number of numbers in the list. The "average" is one numerical characteristic of a frequency distribution (or histogram) which summarizes the frequency distribution. The average is the most commonly used summary of the center of a distribution. [...] 4.4.1 Measures of Center We have seen that the concept of the center of a frequency distribution is a useful one for descriptive purposes. [...] The average is the most widely used measure of the center of a list of numbers. A word of warning: The word "average" is used by some people to include measures of center other than the one we have defined. These people would use the term "arithmetic mean" or simply "mean" for the calculated value we have just defined as "average." In this text we consider "average," "mean," and "arithmetic mean" to have identical meaning.
- Ott, Lyman; Mendenhall, William (1985). Understanding Statistics (4th ed.). Duxbury Press, PWS (Prindle, Weber & Schmidt) Publishers, Wadsworth. ISBN 0-87150-855-9. LCCN 84-18709. pp. 63–70:
4.2: Measure of central tendency Definition 4.3 Numerical descriptive measures that locate the center of a distribution are called measures of central tendency. The most common of these are the arithmetic mean, the median, and the mode. The arithmetic mean Perhaps the most widely used measure of central tendency is the arithmetic mean (or "average") of a set of measurements. [...] The arithmetic mean—or, simply, the mean—is used extensively in many fields of science and business. [...] We have discussed three measures of central tendency—the mean, the median, and the mode—and noted that one measure might be better than the other two in a given situation. We will concern ourselves almost exclusively with the sample mean as a measure of central tendency for the remainder of this text. The reason for this choice is that the sample mean is most widely employed in statistical inference, and the study of inference is our ultimate objective. Recall that we wish to make inferences about the population from which the sample is drawn. A sample mean is not only descriptive of the sample observations but, more importantly, it can easily be used to estimate the population mean with some degree of accuracy.
- Milton, J. Susan; McTeer, Paul M.; Corbet, James J. (1996–1997). Introduction to Statistics. McGraw-Hill. ISBN 0-07-042528-0. LCCN 96-22270. OCLC 34839691. pp. 33–35:
1.3: MEASURES OF LOCATION Recall that a population parameter is a descriptive measure associated with a random variable when it is studied over the entire population. Three parameters that measure the center of the distribution in some sense are of interest. These parameters, called location parameters or measures of central tendency, are the population mean, the population median, and the population mode. Although it is a little too soon to give you a precise technical definition of these terms, we will give you an idea of their meaning and will show you how to approximate the value of each from sample data. [...] Definition 1.1 [...] The sample mean, denoted by , is the arithmetic average of these values.
- McClave, James T.; Dietrich, Frank H. II. A First Course in Statistics (2nd ed.). Dellen Publishing Company & Collier Macmillan Publishers. ISBN 0-02-379110-1. LCCN 85-16268. OCLC 12420091. pp. 28–29:
2.4: Numerical Measures of Central Tendency [...] As you will see, there are a large number of numerical methods available to describe data sets. Most of these methods measure one of two data characteristics: 1. The central tendency of the set of measurements, i.e. the tendency of the data to cluster or to center about certain numerical values. 2. The variability of the set of measurements, i.e. the spread of the data. In this section we concentrate on measures of central tendency. In the next section, we will discuss measures of variability. The most popular and best understood measure of central tendency for a quantitative data set is the arithmetic mean (or simply the mean) of a data set [...] In everyday terms, the mean is the average value of the data set.
- Zimmer, Scott (2024). "Descriptive Statistics". In Nicosia, James F.; Nicosia, Jake D. (eds.). Principles of Probability & Statistics. Salem Press, A Division of EBSCO Information Services, Inc., and Grey House Publishing, Inc. pp. 35–37. ISBN 978-1-63700-752-5. OCLC 1399406582.
ABSTRACT Descriptive statistics are a collection of measurements that provide an overview of a data set. Descriptive statistics provide a statistician with an overall sense of the contents of a distribution. While some detail is lost if one only looks at descriptive statistics without studying the rest of the data, descriptive statistics are a useful way of quickly summarizing the contents of the data set. PRINCIPAL TERMS central tendency: the most commonly occurring value in a distribution, such as the mean, median, or mode [...] INTRODUCTION Descriptive statistics are used to analyze, organize, and summarize data. [...] The extent to which the values in a distribution are spread out from one another is known as dispersion. [...] It can also be helpful to know the distribution's central tendency. The central tendency of a distribution describes how the data cluster together in the distribution and which values are most common. There are several different ways to evaluate the central tendency of a distribution. The mode describes the value that appears most frequently. The mean calculates the average of all values in the distribution. The median is the value that marks the central point of the distribution, with an equal number of values greater than and less than it. [...] MEAN, MEDIAN, AND MODE Central tendency sounds complicated, but it actually describes a fairly simple idea. Central tendency describes the most typical values in a data set. There are several ways of measuring central tendency. One approach is to calculate the average of all the values in the distribution. In statistics this is known as calculating the mean. The mean is calculated by adding together all of the values in the distribution and then dividing the sum by the total number of values. [...] Another type of central tendency measurement is the median. [...] A third measurement of central tendency is known as the mode. [...] No single measure of central tendency tells the whole story of a distribution. Thus, it is common for mean, median, and mode to be reported together.
- Watson, Jane M. (2006). Statistical Literacy at School: Growth and Goals. Lawrence Erlbaum Associates. ISBN 0-8058-5399-5. OCLC 60705759. pp. 97–126:
4: Average—What Does It Tell Us? It is difficult to understand why statisticians commonly limit their inquiries to Averages, and do not revel in more comprehensive views. [...] 4.1 BACKGROUND Francis Galton made this observation at the turn of the 20th century and his criticism continued to be appropriate in many mathematics classrooms throughout the century. What he could not foresee, however, was the appropriation of the term average by the general populace in a wide range of social contexts to describe a variety of conditions related to typicality. In the English language the word average has many connotations, from the colloquial "mediocre" to the mean algorithms taught in mathematics classrooms, both arithmetic and geometric. The association of average with the arithmetic mean by most high school mathematics teachers probably reflects their backgrounds and the history of the mean in the curriculum, but it is unlikely to reflect the everyday connections made by their students. The arithmetic mean has a checkered history that has left it by default as the major summary statistic employed at the school level. For that reason, average is the focus of attention in the chapter on the data reduction phase of the statistical investigation process. This does not mean that other ideas for reducing the complexity of data are not relevant and some of these are considered. Historically the arithmetic mean has probably been associated with the mathematics curriculum longer than any other idea or tool used by statisticians. [...] It was not until the end of the 20th century that the mode and median were introduced in to the school mathematics curriculum in conjunction with the data handling curriculum.4. Australian Education Council (1991, 1994a); Department for Education (1995); Ministry of Education (1992); National Council of Teachers of Mathematics (1989, 2000). This history probably explains why the mean is still the focus of many teachers in the classroom—it is the measure with which they are most familiar. Despite moves to non-parametric statistics, the mean is also still the most commonly used statistic overall in science and society. The mode is the most controversial of the three measures with some statisticians claiming it is not a measure of central tendency.5. Utts (1999), displays some skepticism in saying "Another measure of 'center,' called the mode, is occasionally useful" (p. 107). [...] Very little research has specifically considered ideas associated with the median or mode but Jan Mokros and Susan Jo Russell for example found "middle" and "most' ideas suggested by students in their study when asking more generally about average,10. Mokros & Russell (1995). as is seen in some of the responses in this chapter. [...] The focus on the algorithm for the arithmetic mean to produce a correct answer for every "average" problem needs to be replaced with a focus on context to make meaningful summary comments about data sets using appropriate measures of middle. In particular, average, in whichever guise, as a reflection of central tendency needs to be related to spread and variation within data. In terms of the contribution made to statistical literacy by the idea of average, the three measures of mean, median, and mode are all important. The term average, however, is sometimes presented in the media in a way that makes it difficult to tell what statistic is being used as a measure. On one hand the arithmetic mean may be assumed to be the "average" when it is not. Its susceptibility to extreme values may make it inappropriate but being hidden behind the term "average" makes it difficult to tell whether the mean has been used or not. [...] The median is very likely to be the average reported when government figures are produced about human populations.13. "Aussies living for longer, ABS says" (1994). [...] The following sections of this chapter use examples of students' responses to tasks involving averages to highlight the development taking place during the school years and the connections that assist in broadening the data reduction phase of statistical investigations. Because average is a term like sample that has uses outside of statistics, it is important for teachers to know what students are thinking at the beginning of any classroom discussion on the topic. The issue of colloquial usage in ration to all three measures of central tendency is the focus of Section 4.2 and again many ideas that teachers take for granted may not be obvious to their students.
- Peters, William S. (1986–1987). Counting for Something: Statistical Principles and Personalities. Springer Texts in Statistics. Springer-Verlag. LCCN 86-11866. OCLC 13580827. ISBN 0-387-96364-2, 3-540-96364-2. pp. 8–25:
Summary Measures The mean and the standard deviation are the summary measures of the distribution of a variable that we want to show now. The mean is a measure of average, or central location, and the standard deviation is a measure of variability. From the original data of Table 2-1, the mean age is [...] X with an overbar (called X-bar) is the symbol for the mean. [...] Chapter 3 Special Averages One reason the mean is such a widely used average is that it lends itself to calculations of the following kind. [...] Some of the averages that we will look at in this section are weighted averages, and the key to understanding and using them is to understand how weights work and what they can do. [...] In 1922 Irving Fisher (1867–1947), a respected economist, published his study The Making of Index Numbers. 4. Irving Fisher, The Making of Index Numbers, Houghton Mifflin, Boston, 1923, p. 459. He compiled 134 formulas that had been used or suggested for constructing price indexes. These involve the use of different construction methods such as averages of relatives vs relatives of aggregates, different methods of averaging such as mean versus median versus other averages, and different methods of weighting such as Laspeyres verses Paasche. [...] The Harmonic Mean An average with some special properties and uses is the harmonic mean. [...] The reason that the harmonic mean is the correct average here is that the numerators of the original ratios to be averaged were equal. [...] Averaging Time Rates When rates are connected in a time sequence, special methods of averaging are called for.
- Wright, Daniel B. (2002). First Steps in Statistics. Sage Publications. ISBN 0-7619-5163-6. LCCN 2001-132951. OCLC 48361918. pp. 1–9:
1: Introducing Statistics [...] 'it takes about twenty minutes to cook rice', is a statistical phrase because of the word 'about'. Depending on the amount and type of rice, the initial heat of the water, the type of stove and even the altitude at which you are cooking, the amount of time it takes to cook rice is not constant, but varies. Translating this into statistics it becomes 'twenty minutes is the central tendency for the time to cook rice, but the exact time may vary from this'. 'Central tendency' is what the statisticians would call what is written on the side of the rice box suggesting how long to cook the rice. It is the value that, across all situations, the rice manufacturers think is the best guess for proper cooking time. There are different and more precise ways of calculating the central tendency which will be considered later in this chapter. [...] Four Statistics The remaining focus of this chapter is on four statistics: the mean, the median, the mode and the proportion. Each is a measure of central tendency and each describes some characteristic of the sample. They are used in different circumstances. At the end of this chapter I will describe some of the considerations that you should think about when deciding which of these statistics to use. The Mean Some words that are used in statistics have different definitions in English. The definition of 'mean' is not that of a particularly ill-tempered statistic. instead it more closely refers to what, in English, we call the average. [...] Finally you divide this sum by the number of cases. [...] The Median A few very high or very low points can have a large impact on the mean. In some cases this is good. Consider the rainfall example. If you were interested in reservoir levels, you would want Wednesday's 6 cm of rainfall to have a large impact. However, if you were a tourist you probably would want to know what the typical day was going to be like. The mean does not tell you this. The median is often used in these circumstances. It is the 'middle' point. [...] The Mode and Proportions The mode is the value that occurs most often. How often it occurs is its proportion. [...] The proportion is the frequency of a response divided by the total sample size. [...] When to Use Each Measure Several measures of central tendency were presented in the last section and other less common ones also exist. Each describes a different aspect of the data and each is more appropriate in different situations. [...] It is worth nothing that when researchers are deciding between the mean and the median, they usually prefer working with means. Many statistical procedures have been developed to look at means. Because of this researchers usually look at the mean unless they have a reason not to. That said, there has been a welcomed increase in the past 10 years on using procedures that do not use the mean (Wilcox, 1998, discusses some recent advances. Chapter 9 of this book covers some of the more traditional alternatives).
- Upton, Graham; Cook, Ian (2006). (A) (Oxford) Dictionary of Statistics. Oxford University Press. ISBN 978-0-19-861431-9. OCLC 69021966. pp. 24–25, 73, 266–269:
average For a set of data, a loosely used term for a *measure of location—either the *mode, or in the case of numerical data, the *median or the *mean. Its meaning is often restricted to this last case. See also MOVING AVERAGE, WEIGHTED AVERAGE. [...] mean (data) The mean of a set of n items of *data is , which is the arithmetic mean of the numbers . The mean is usually denoted by placing a bar over the symbol for the variable being measured. [...] central tendency (centrality) The tendency of quantitative *data to cluster around some central value. The central value is commonly estimated by the *mean, *median, or *mode, whereas the closeness with which the values surround the central value is commonly quantified using the *standard deviation or *variance. The phrase 'central tendency' was first used in the late 1920s. [...] mean (population) See POPULATION MEAN. mean (random variable) See EXPECTED VALUE. [...] measure of location For a set of *data, or a *population, a single number, or data value, which is in some sense in the middle of the data, or the population. See MEAN; MEDIAN; MIDRANGE; MODE.
- Mattson, Dale E. (1984) [formerly published by the C.V. Mosby Company, 1981]. Statistics: Difficult concepts, understandable explanations (Revised ed.). Bolchazy-Carducci Publishers, Inc. ISBN 0-86516-056-2. LCCN 80-24947. OCLC 11572748. pp. 28–33:
Chapter 3: Summary statistics Lesson 1: Symbols and measures of central tendency [...] MEASURES OF CENTRAL TENDENCY The mean. [...] The mean is the arithmetic average that you get by adding up all of the measurements in a group and then dividing by the total number. It is what most people think of when they refer to an "average." [...] The mean is the most used measure of central location or tendency. [...] The median. Another measure of the central tendency of a distribution of observations is called the median. [...] The mode. The mode is another measure of central tendency that is sometimes used, largely because of ease of computation. [...] In some instances, two different values that are widely separated may be tied for highest frequency, or the same may be true of two classes in a frequency distribution. In this instance, the distribution is said to be bimodal.
- Kooker, Earl W.; Robb, George P. (1982). Introduction To Descriptive Statistics. Springfield, Illinois, U.S.A.: Charles C Thomas. ISBN 0-398-04564-X. LCCN 81-8908. OCLC 7573901. pp. 40–41:
Chapter III: CENTRAL TENDENCY The graphing and ranking of scores or other values will facilitate the understanding of the data, but there are additional procedures that may be used for this purpose. One such procedure is the determination of one or more measures of central tendency. The three commonly used measures of central tendency are the mode, the median, and the mean. All three may be referred to as averages. These measures are useful because they indicate points of concentration in distributions of scores, and such points tend to characterize the distributions of the groups they represent. Because this is so, measures of central tendency also enable us to make comparisons between or among groups. [...] MEDIAN, MODE, AND MEAN The median, or fiftieth percentile, was discussed in the previous chapter. [...] In certain contexts the median is also referred to as the norm. [...] The mode ordinarily may be found by inspection, for it is merely the most common or most frequently made score. Frequently, it will be near the median. [...] The mean (arithmetic mean) corresponds to what frequently in everyday language is referred to as the "average."
- Johnson, Richard A.; Bhattacharyya, Gouri K. (2001). Statistics: Principles And Methods (4th ed.). John Wiley & Sons, Inc. ISBN 0-471-38897-1. LCCN 00-039274. OCLC 43864399. pp. 45–47:
4. MEASURES OF CENTER The graphic procedures described in Section 3 help us to visualize the pattern of a data set of measurements. To obtain a more objective summary description and a comparison of data sets, we must go one step further and obtain numerical values for the location or center of the data and the amount of variability present. [...] The most important aspect of studying the distribution of a sample of measurements is locating the position of a central value about which the measurements are distributed. The two most commonly used indicators of center are the mean and the median. The mean or average of a set of measurements is the sum of the measurements divided by their number. [...] According to the concept of "average," the mean represents a center of a data set. [...] Another measure of center is the middle value. The sample median of a set of measurements is the middle value when the measurements are arranged from smallest to largest.
- Freund, Rudolf J.; Wilson, William J. (2003). Statistical Methods (2nd ed.). Academic Press, an imprint of Elsevier Science. ISBN 0-12-267651-3. LCCN 2002111023. OCLC 50652976. pp. 19–23:
1.5: Numerical Descriptive Statistics [...] The two most important aspects are the location and the dispersion of the data. In other words, we need to find a number that indicates where the observations are on the measurement scale and another to indicate how widely the observations vary. Location The most useful single characteristic of a distribution is some typical, average, or representative value that describes the set of values. Such a value is referred to as a descriptor of location or central tendency. Several different measures are available to describe this concept. We present two in detail. Other measures not widely used are briefly noted. The most frequently used measure of location is the arithmetic mean, usually referred to simply as the mean. [...] Another useful measure of location is the median. [...] Other occasionally used measure of location are as follows. 1. The mode is the most frequently occurring value. This measure may not be unique in that two (or more) values may occur with the same greatest frequency. Also, the mode may not be defined if all values occur only once, which usually happens with continuous numeric variables. 2. The geometric mean [...] 3. The midrange
- Fleming, Michael C.; Nellis, Joseph G. (1994). Principles of Applied Statistics. Routledge series in the principles of management. Routledge. ISBN 0-415-07379-0. OCLC 29519869. pp. 39–41:
Chapter 3: Describing data — averages OBJECTIVES In the last chapter we examined ways of visually describing a set of data using tables and graphs. We now introduce techniques for numerically describing a set of data by using summary measures. There are two main features of a set of data to be measured, namely its central location (i.e. average value) and its dispersion (i.e. variability of the data). In this chapter we deal with the first of these while the next chapter deals with the second feature. There are four measures of central location that are commonly used, the choice depending on the nature of the data and the purpose of measurement. These are: * arithmetic mean * median * mode * geometric mean PRINCIPLES Arithmetic mean The arithmetic mean is the most popular measure of central location and is merely the average of the data. It is often simply referred to as the mean. [...] Median [...] Mode [...] It should be noted that in some data sets there may be no mode, whereas in other data sets there may be more than one mode. If a mode clearly exists, then the distribution of values is said to be unimodal. A dstribution is referred to as bimodal if there is a two-way tie for the most frequently occurring value. If a set of data is not exactly bimodal but contains two values that are more dominant than the others, some researchers take the liberty of referring to the data set as bimodal even though there is not an exact tie for the mode. Data sets with more than two modes are referred to as multimodal.
- Denker, Manfred; Woyczyński, Wojbor A. (1998). Introductory Statistics and Random Phenomena: Uncertainty, Complexity and Chaotic Behavior in Engineering and Science, with Mathematica® Uncertain Virtual Worlds™ by Bernard Ycart. Birkhäuser Boston. ISBN 0-8176-4031-2. LCCN 98-4735. OCLC 38281629. pp. 70–80:
2.3 Numerical data: histograms, means, moments [...] If the relative frequency d.f. of a sample is known, then a number of numerical characteristics of the sample, compressing the information contained in a sample to a single number, are easily calculated. In particular, the fundamental location characteristic, the sample mean , which is simply an arithmetic average of sample points, but a weighted average of possible values , with the relative frequency d.f. providing the weights. [...] 2.4 Location, dispersion, and shape parameters In this section we will return to some of the characteristic parameters introduced in Sections 2.2 and 2.3, introduce some new ones, and provide their comparison from the viewpoint of the type of information they provide. Location Parameters. The sample mean and the sample median are obviously the prime location parameters indicating where the sample is centered. They, however, need not coincide. [...] In public discussions one can often observe a tendentious selection of the parameters used depending on the agenda of the selector. Several other location parameters are commonly used. (a) The mode is the value in the data set which corresponds to the local maximum of the frequency d.f., or, equivalently, of the histogram. A data set can have several modes. The principal mode is a mode that corresponds to the global maximum of the frequency d.f. It need not be unique, either. (b) As we observed in Section 2.3 (Remark 2.3.1), the sample mean scales linearly and it is always within the sample interval, that is . However, it is not the only function of sample points with the above properties. For example, the weighted sample mean, [...] is another example of such a "mean" location characteristic. (c) Sometimes, for practical reasons, one may opt for another version of the "mean" called censored mean. [...] (d) Another location parameter compressing the data is the so-called harmonic mean [...] Remark 2.4.1. Mean and Median Under One Umbrella. For more theoretically minded readers, we would like to mention that both mean and median are special cases of the so-called M-estimators which are produced from the sample by means of a weight function which is assumed to be increasing. Then the sample ψ-mean is defined as a number such that . For , the ψ-sample mean is the usual sample mean. For (defined as equal to +1 for , and -1 for , and 0 at 0), the ψ-mean is the sample median. Obviously, quartiles, percentiles, and other quantiles can also be considered as more subtle location parameters of the data sets. Remark 2.4.2 A General Concept of the Mean. A number is said to be a mean of sample (, say) with respect to function if . In other words, replacing the sample points by the sample mean does not affect the value of the function. In mechanics of rigid bodies one uses the analogous concept of the barycenter. The system evolves as if the whole mass of the body were concentrated at the barycenter. The usual sample mean corresponds to the selection , the harmonic mean to , and the geometric mean to . A mean is called associative if it is not affected by the replacements of some subsets of sample points by their mean. The above three means are all associative. Nagumo and Kolmogorov proved that all associative means are (increasing) transforms of arithmetic weighted means. More precisely, if is such a mean then one can find an increasing function and the weights , , such that . In other words, they are all obtained by changing the scale of sample points via application of function , calculating the (weighted) arithmetic average, and then reverting to the original scale by applying the inverse function . For example, the geometric mean corresponds to , with . The γ-mean is greater than the arithmetic (linear) mean if the function γ is concave upwards. Fig. 2.4.1 suggests the obvious way to prove it. One can also check that the means increase with the quantity , which measures the local concavity upwards. For power functions we have , which increases with . The geometric mean corresponds to the case of . In this fashion one can establish that the various means satisfy the following inequalities:
- Coolidge, Frederick L. (2006). Statistics: A Gentle Introduction (2nd ed.). Sage Publications. ISBN 1-4129-2494-4. LCCN 2005022221. OCLC 61204398. pp. 67–68:
3: Statistical Parameters Measures of Central Tendency and Variation [...] Measures of Central Tendency In addition to graphs and tables of numbers, statisticians often use common parameters to describe sets of numbers. There are two major categories of these parameters. One group of parameters measures how a set of numbers is centered around a particular point on a line scale or, in other words, where (around what value) the numbers bunch together. This category of parameters is called measures of central tendency. You already know and have used the most famous statistical parameter from this category, which is the mean or average. The Mean The mean is the arithmetic average of a set of scores. There are actually different kinds of means, such as the harmonic mean (which will be discussed later in the book) and the geometric mean. We will first deal with the arithmetic mean. The mean gives someone an idea where the center lies for a set of scores.
- Clarke, G. M.; Cooke, D. (1998). A Basic Course In Statistics (4th ed.). Arnold, a member of the Hodder Headline Group; & Oxford University Press Inc. ISBN 0-340-71995-8. OCLC 39313610. pp. 19–21:
2: Measures of the centre of a set of observations Overview How do we choose a single value to represent a set of observations? We look at possible choices in this chapter. [...] 2.3 The arithmetic mean Another measure of the centre of a set of observations is the arithmetic mean (very often simply called 'the mean'). Definition 2.2 The (arithmetic) mean
- Anderson, T.W.; Finn, Jeremy D. (1996). The New Statistical Analysis Of Data. Springer-Verlag New York, Inc. ISBN 0-387-94619-5. LCCN 95-44885. OCLC 33334252. SPIN 10518908. pp. 69–77:
3: Measures of Location Introduction After a set of data has been collected, it must be organized and condensed or categorized for purposes of analysis. In addition to graphical summaries, numerical indices can be computed that summarize the primary features of the data set. One is an indicator of location or central tendency that specifies where the set of measurements is "located" on the number line; it is a single number that designates the center of a set of measurements. In this chapter we consider several indices of location and show how each of them tells us about a central point in the data. [...] 3.3 The Mean Definition and Interpretation of the Mean Definition. The mean of a set of numbers is the familiar arithmetic average. There are other kinds of "means," but the term "mean" by itself is understood as denoting the arithmetic average. It is the measure of central tendency most used for numerical variables.
- Spiegel, Murray R. (1988). (Schaum's Outline of) (Theory and Problems of) Statistics. Schaum's Outline Series (in Mathematics) (2nd ed.). McGraw-Hill. ISBN 0-07-060234-4. LCCN 88-26657. OCLC 18560515. pp. 58–65:
- As you can see, while some authors do indeed use the words "average" and "mean" to refer specifically to the arithmetic mean (often implicitly), many use them more generally, especially in the plural ("averages" and "means"). Many of them even themselves acknowledge that others use the terminology differently, so I think we too should point out this ambiguity, and present both the arithmetic mean and the broader concept as valid interpretations.
- Solomon Ucko (talk) 05:54, 16 February 2026 (UTC)
- Here are the terms these sources use to refer to the general concept, in alphabetical order:
- average
- average value
- center
- central location
- central tendency
- central point
- central value
- descriptor of location
- kind of average
- indicator of center
- indicator of location
- location
- location characteristic
- location of the center
- location parameter
- mean
- measure of center
- measure of central location
- measure of central tendency
- measure of location
- measure of middle
- measure of the centre
- method of averaging
- middle
- most typical value
- summary of the center
- type of average
- typical measure
- typical parameter
- typical score
- typical value
- While "(measure of) central tendency" does seem to be the most commonly used, McClave & Dietrich (1985/1986), Zimmer (2024), Coolidge (2006), and particularly Upton & Cook (2006) show that this term is confusing and, rather than referring to where the values tend towards, could instead refer to how much they tend towards it. Likewise, terms involving the word "parameter" are probably best to avoid, since parameters normally refer to the inputs used to select a distribution from a family of distributions. As has already been discussed on this talk page ad nauseum, "average" and "mean" are often used specifically to refer to the arithmetic mean, so they would be a poor choice of a general term as well.
- The terms I am most in favor of are:
- central value (used by e.g. Iversen & Gergen 1997, Upton & Cook 2006, Johnson & Bhattacharyya 2001)
- measure of center (used by e.g. Weiss 2005, Weldon 1986, Johnson & Bhattacharyya 2001)
- measure of location (used by e.g. Rees 1987, Kendall & Stuart 1977, Twaite & Monroe 1979, Milton et al. 1996/1997, Upton & Cook 2006, Freund & Wilson 2003, Anderson & Finn 1996)
- A disadvantage of including the word "center" or "central" is that it would needlessly exclude statistics that describe position but are asymmetric, such as minimum, maximum, quart/percent/etc.-iles, etc.
- So while I initially preferred "central value", I am now leaning towards "measure of location". What do other people think?
- Solomon Ucko (talk) 06:49, 16 February 2026 (UTC)
- Here are the terms these sources use to refer to the general concept, in alphabetical order:
- P.S. Here are some more relevant quotes from textbooks:







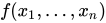


![{\displaystyle f(x_{1},\dots ,x_{n})=[(1/x_{1}+\dots +1/x_{n})/n]^{-1}}](https://wikimedia.org/api/rest_v1/media/math/render/svg/1bb10776b72237d5fc3a42a5cd69d4356d9b8d59)


Merge proposal
The following discussion is closed. Please do not modify it. Subsequent comments should be made on the appropriate discussion page. No further edits should be made to this discussion.
I propose that we merge central tendency into average. —Quantling (talk | contribs) 20:52, 9 February 2026 (UTC)
- Merge - Both these pages discuss the various alternatives to arithmetic mean that migh be meant by average or central tendency. There is a tremendous amount of overlap between the two. —Quantling (talk | contribs) 20:52, 9 February 2026 (UTC)
- Merge:
- Makes sense to me. There's a lot of overlap with mean too, and merges with both have been proposed in the past. This would also be a good opportunity to clean up and reorganize some things.
- What do you think of the following phrasing and structure?
- In mathematics, particularly statistics, a central value, a mean, or an average of a collection or a probability distribution is an actual or hypothetical member in the middle of it that summarizes it by representing its overall position. (The word "average" is also used outside of mathematics to mean common, typical, or normal.) A "(measure of) central tendency" may refer either to a central value, or to how close the data is to that central value (i.e. statistical dispersion).
- The phrases "the average" and "the mean" almost always refer specifically to the arithmetic mean (or for a probability distribution, expected value), though other meanings are occasionally used depending on the context. For example, in education, "average" sometimes refers to "the three Ms" of (arithmetic) mean, median, and mode; additionally, the harmonic mean is implied in many situations involving rates or ratios.
- In statistics, the sample (arithmetic) mean is denoted using an overline (e.g. , pronounced "x bar", equals ), and the population mean is denoted with the Greek letter mu (, pronounced /'mjuː/).
- Properties ... (with content from Average § General properties)
- Types ... (with content from Average §§ Statistical location, Summary of types, and Miscellaneous types; Central tendency §§ Measures and Solutions to variational problems; Mean §§ Types of means and Other means)
- Arithmetic mean ... (with content from Mean §§ Mean of a probability distribution and Mean of a function)
- Quasi-arithmetic means ... [table with columns "Name", "", "", "Formula", "Optimization problem"] (with content from Average § Pythagorean means; Mean §§ Pythagorean means, Generalized means, Mean of angles and cyclical quantities, and Fréchet mean)
- Other central values [table with columns "Name", "Formula or description", "Optimization problem"]
- Variants (these are listed separately because they can be applied to any kind of mean)
- Weighted mean ... (with content from Mean § Weighted arithmetic mean)
- Winsorized mean ...
- Truncated mean ... (with content from Mean §§ Truncated mean and Interquartile mean)
- Moving average ... (with content from Average § Moving average)
- Relationships ... (with content from Average § Pythagorean means; Central tendency § Relationships between the mean, median and mode; Mean § Relationship between AM, GM, and HM)
- Applications ... (with content from Average §§ Definitions and Average percentage return and CAGR; Mean §§ Statistical location, Mean of angles and cyclical quantities, and Swanson's rule)
- History ... (with content from Average § History; lead of Central tendency)
- Limitations ... (with content from Average § Averages as a rhetorical tool)
- Standard footer sections: "See also", "Notes", "References", "Further reading", "External links"
- Solomon Ucko (talk) 00:27, 10 February 2026 (UTC)


- Sollyucko Feel free to perform the merge as you've proposed! FaviFake (talk) 21:19, 7 May 2026 (UTC)
- I don't agree with the process. Why was there no notice posted on the talk pages for Mean and Central tendency?— xo Ergur (talk) 12:36, 8 May 2026 (UTC)
- Sorry, I didn't realize that was expected.
- The article page "Central tendency" has had a notice for months: https://en.wikipedia.org/w/index.php?title=Central_tendency&diff=1337497238&oldid=1315557508
- I should've also put one at "Mean", oops. There is one now: https://en.wikipedia.org/w/index.php?title=Mean&diff=1353050073&oldid=1352633122
- Should I also add notices to their talk pages and then wait a few days for further feedback?
- FWIW, I'm planning to write a combined page in draftspace, at say, Draft:Measure of location (as the name I proposed at https://en.wikipedia.org/wiki/Talk:Average#c-Sollyucko-20260216064900-Sollyucko-20260216055400), with a structure similar to what I proposed in https://en.wikipedia.org/wiki/Talk:Average#c-Sollyucko-20260210002700-Quantling-20260209205200, and then after getting consensus on it, move it to article space and change all three of these pages to redirect to it. Would that be reasonable?
- Just to clarify, in addition to your procedural objection, do you have any thoughts on the substance of this proposal?
- Solomon Ucko (talk) 15:57, 8 May 2026 (UTC)
- Ergur is incorrect, these merge tags mustn't be placed on talk pages, only on articles (WP:AFD2). If you had placed them on the talk pages, they would've likely been removed by other editors checking the backlog. FaviFake (talk) 19:00, 8 May 2026 (UTC)
- I also disagree with this process. Consensus was reached after only two people contributed. I would highly recommend having this discussion and RfC on the Average talk page, as I would venture to guess that's the more widely-used colloquial term. I don't necessarily disagree that the merge should occur, but this does not seem like a good place for the merge discussion. In any case, the article would need to be listed at AfD and a discussion should happen there. AzureWizard (talk) 00:34, 5 June 2026 (UTC)
- I'm confused why you're recommending "having this discussion and RfC on the Average talk page" given that that is already where it occurred? Talk:Average § Merge proposal
- Listing this at AfD makes sense to me, with the goal of merging all three articles into one combined article, and then changing them to redirect to it, not deleting any of them.
- Meanwhile, I started working on Draft:Measure of location, but I've now gotten busy and I doubt I'll have much time to finish within the next couple months, so if someone would be willing to take it over, I'd appreciate it.
- I've cleaned up the lead of the article, the section "Properties", and the lead of the section "Types", but the subsections of "Types", as well as the entirety of the subsequent sections, still need review and often rewriting and reorganizing.
- I'm happy to provide my thoughts/advice for what to do with the rest, if that would be helpful, but my own ideas should not be construed as community consensus.
- Solomon Ucko (talk) 01:58, 5 June 2026 (UTC)
- This was a formal WP:PAM discussion and it was held at the correct page, as was explained above. Since you don't disagree with the result I think it is best to just wait for someone to perform it. FaviFake (talk) 13:12, 5 June 2026 (UTC)
- I don't agree with the process. Why was there no notice posted on the talk pages for Mean and Central tendency?— xo Ergur (talk) 12:36, 8 May 2026 (UTC)

 Merge completed Klbrain (talk) 14:51, 25 July 2026 (UTC)


Content Disclaimer
Informasi ini disarikan dari Wikipedia dan disajikan kembali untuk tujuan edukasi. Konten tersedia di bawah lisensi CC BY-SA 3.0. Kami tidak bertanggung jawab atas ketidakakuratan data yang bersumber dari kontribusi publik tersebut.
- The information displayed on this website is sourced in part or in whole from Wikipedia and has been adapted for the purpose of restating it. We strive to provide accurate and relevant information, however:
- There is no guarantee of absolute accuracy. Wikipedia is an open, collaborative project that can be edited by anyone, so information is subject to change.
- It is not intended to constitute professional advice. The content displayed is for informational and educational purposes only. For important decisions (e.g., medical, legal, or financial), please consult a professional.
- Content copyright. Wikipedia is licensed under the Creative Commons Attribution-ShareAlike License (CC BY-SA). This means that content may be reused with appropriate attribution and shared under a similar license.
- Responsible use. Any risk arising from the use of information from this website is entirely the responsibility of the user.