Municipality and town in Tolima Department, Colombia
Purificación, Tolima |
|---|
|
 Flag  Seal |
| Nickname(s): Puri, villa de las palmas (palm tree town) |
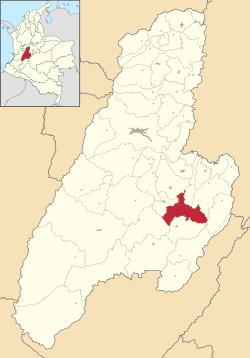 Location of the municipality and town of Purificación, Tolima in the Tolima Department of Colombia. |
| Country |  Colombia Colombia |
|---|
| Department | Tolima Department |
|---|
| Province | Southeastern |
|---|
|
| • 2020 | Cristián Andrés Barragán |
|---|
|
| • Total | 422 km2 (163 sq mi) |
|---|
| Elevation | 329 m (1,079 ft) |
|---|
|
| • Total | 29,539 |
|---|
| Time zone | UTC-5 (Colombia Standard Time) |
|---|
Purificación is a town and municipality in the Tolima department of Colombia.[1]
Climate
| Climate data for Purificacion (Lozania), elevation 400 m (1,300 ft), (1981–2010)
|
| Month
|
Jan
|
Feb
|
Mar
|
Apr
|
May
|
Jun
|
Jul
|
Aug
|
Sep
|
Oct
|
Nov
|
Dec
|
Year
|
| Mean daily maximum °C (°F)
|
32.2
(90.0)
|
32.3
(90.1)
|
32.1
(89.8)
|
31.4
(88.5)
|
31.3
(88.3)
|
31.5
(88.7)
|
32.1
(89.8)
|
33.2
(91.8)
|
32.8
(91.0)
|
31.7
(89.1)
|
31.3
(88.3)
|
31.5
(88.7)
|
32.0
(89.6)
|
| Daily mean °C (°F)
|
26.5
(79.7)
|
26.6
(79.9)
|
26.5
(79.7)
|
26.2
(79.2)
|
26.2
(79.2)
|
26.0
(78.8)
|
26.0
(78.8)
|
26.6
(79.9)
|
26.7
(80.1)
|
26.3
(79.3)
|
26.3
(79.3)
|
26.4
(79.5)
|
26.4
(79.5)
|
| Mean daily minimum °C (°F)
|
20.7
(69.3)
|
20.7
(69.3)
|
20.8
(69.4)
|
21.4
(70.5)
|
20.8
(69.4)
|
20.2
(68.4)
|
19.9
(67.8)
|
19.9
(67.8)
|
20.2
(68.4)
|
20.9
(69.6)
|
21.0
(69.8)
|
21.0
(69.8)
|
20.6
(69.1)
|
| Average precipitation mm (inches)
|
119.6
(4.71)
|
146.8
(5.78)
|
215.9
(8.50)
|
231.7
(9.12)
|
193.7
(7.63)
|
85.2
(3.35)
|
49.7
(1.96)
|
53.7
(2.11)
|
135.8
(5.35)
|
288.6
(11.36)
|
280.0
(11.02)
|
186.9
(7.36)
|
1,976.5
(77.81)
|
| Average precipitation days
|
11
|
13
|
16
|
18
|
18
|
14
|
11
|
9
|
13
|
19
|
18
|
15
|
175
|
| Average relative humidity (%)
|
80
|
80
|
82
|
84
|
84
|
82
|
79
|
75
|
77
|
81
|
83
|
82
|
80
|
| Source: Instituto de Hidrologia Meteorologia y Estudios Ambientales[2]
|
| Climate data for Purificación (Sta Helena), elevation 300 m (980 ft), (1981–2010)
|
| Month
|
Jan
|
Feb
|
Mar
|
Apr
|
May
|
Jun
|
Jul
|
Aug
|
Sep
|
Oct
|
Nov
|
Dec
|
Year
|
| Mean daily maximum °C (°F)
|
32.9
(91.2)
|
33.1
(91.6)
|
32.7
(90.9)
|
31.7
(89.1)
|
31.7
(89.1)
|
32.2
(90.0)
|
33.1
(91.6)
|
34.1
(93.4)
|
33.3
(91.9)
|
31.9
(89.4)
|
31.5
(88.7)
|
31.9
(89.4)
|
32.5
(90.5)
|
| Daily mean °C (°F)
|
27.9
(82.2)
|
27.8
(82.0)
|
27.7
(81.9)
|
27.1
(80.8)
|
27.1
(80.8)
|
27.3
(81.1)
|
27.6
(81.7)
|
28.3
(82.9)
|
27.9
(82.2)
|
27.0
(80.6)
|
27.0
(80.6)
|
27.3
(81.1)
|
27.5
(81.5)
|
| Mean daily minimum °C (°F)
|
22.9
(73.2)
|
22.9
(73.2)
|
23.0
(73.4)
|
22.9
(73.2)
|
22.7
(72.9)
|
22.3
(72.1)
|
21.8
(71.2)
|
22.2
(72.0)
|
22.6
(72.7)
|
22.5
(72.5)
|
22.6
(72.7)
|
22.8
(73.0)
|
22.6
(72.7)
|
| Average precipitation mm (inches)
|
89.9
(3.54)
|
118.7
(4.67)
|
155.4
(6.12)
|
230.3
(9.07)
|
210.3
(8.28)
|
82.1
(3.23)
|
57.0
(2.24)
|
52.0
(2.05)
|
141.5
(5.57)
|
228.0
(8.98)
|
193.5
(7.62)
|
142.0
(5.59)
|
1,696.5
(66.79)
|
| Average precipitation days
|
8
|
10
|
12
|
17
|
17
|
10
|
8
|
7
|
11
|
16
|
15
|
11
|
141
|
| Average relative humidity (%)
|
74
|
73
|
75
|
77
|
77
|
75
|
71
|
68
|
70
|
76
|
77
|
76
|
74
|
| Mean monthly sunshine hours
|
127.1
|
107.3
|
102.3
|
99.0
|
124.0
|
168.0
|
182.9
|
192.2
|
159.0
|
111.6
|
105.0
|
120.9
|
1,599.3
|
| Mean daily sunshine hours
|
4.1
|
3.8
|
3.3
|
3.3
|
4.0
|
5.6
|
5.9
|
6.2
|
5.3
|
3.6
|
3.5
|
3.9
|
4.4
|
| Source: Instituto de Hidrologia Meteorologia y Estudios Ambientales[2]
|
References
3°52′N 74°56′W / 3.867°N 74.933°W / 3.867; -74.933
.svg)

