Crime has been recorded in the United States since its founding and has fluctuated significantly over time, with a sharp rise after 1900 and reaching a broad bulging peak between the 1970s and early 1990s. After 1992, crime rates have generally trended downwards each year, with the exceptions of a slight increase in property crimes in 2001 and increases in violent crimes in 2005-2006, 2014-2016 and 2020-2021.[1] While official federal crime data beginning in 2021 has a wide margin of error due to the incomplete adoption of the National Incident-Based Reporting System by government agencies, federal data for 2020-2021 and limited data from select U.S. cities collected by the nonpartisan Council on Criminal Justice showed significantly elevated rates of homicide and motor vehicle theft in 2020-2022.[1][2][3] Although overall crime rates have fallen far below the peak of crime seen in the United States during the late 1980s and early 1990s,[4][5] the homicide rate in the U.S. has remained high, relative to other "high income"/developed nations, with eight major U.S. cities ranked among the 50 cities with the highest homicide rate in the world in 2022. The aggregate cost of crime in the United States is significant, with an estimated value of $4.9 trillion reported in 2021.[6] Data from the first half of 2023[update], from government and private sector sources show that the murder rate has dropped, as much as 12% in as many as 90 cities across the United States.[7] The drop in homicide rates is not uniform across the country however, with some cities such as Memphis, TN, showing an uptick in murder rates.[7]
The basic aspect of a crime considers the offender, the victim, type of crime, severity and level, and location. These are the basic questions asked by law enforcement when first investigating any situation. This information is formatted into a government record by a police arrest report, also known as an incident report. These forms lay out all the information needed to put the crime in the system and it provides a strong outline for further law enforcement agents to review. Society has a strong misconception about crime rates due to media aspects heightening their fear factor.[8] The system's crime data fluctuates by crime depending on certain influencing social factors such as economics, the dark figure of crime, population, and geography.[8]
Crime over time
Property crime rates in the United States per 100,000 population beginning in 1960. Source: Bureau of Justice Statistics.
In the long term, violent crime in the United States has been in decline since colonial times. The homicide rate has been estimated to be over 30 per 100,000 people in 1700, dropping to under 20 by 1800, and to under 10 by 1900.[9]
After World War II, crime rates increased in the United States, peaking from the 1970s to the early-1990s. Violent crime nearly quadrupled between 1960 and its peak in 1991. Property crime more than doubled over the same period. Since the 1990s, however, contrary to common misconception,[10] crime in the United States has declined steadily, and has significantly declined by the late 1990s and also in the early 2000s. Several theories have been proposed to explain this decline:
The lead–crime hypothesis suggests reduced lead exposure as the cause; Scholar Mark A.R. Kleiman writes: "Given the decrease in lead exposure among children since the 1980s and the estimated effects of lead on crime, reduced lead exposure could easily explain a very large proportion—certainly more than half—of the crime decrease of the 1994–2004 period. A careful statistical study relating local changes in lead exposure to local crime rates estimates the fraction of the crime decline due to lead reduction as greater than 90 percent.[11]
The number of police officers hired and employed to various police forces increased considerably in the 1990s.[12]
On September 16, 1994, PresidentBill Clinton signed the Violent Crime Control and Law Enforcement Act into law. Under the act, over $30 billion in federal aid was spent over a six-year period to improve state and local law enforcement, prisons and crime prevention programs. Proponents of the law, including the President, touted it as a lead contributor to the sharp drop in crime which occurred throughout the 1990s, while critics have dismissed it as an unprecedented federal boondoggle.[13]Total incarceration in the United States by year
Starting in the mid-1980s, the crack-cocaine market grew rapidly before declining again a decade later. Some authors have pointed towards the link between violent crimes and crack use.[12]
Legalized abortion reduced the number of children born to mothers in difficult circumstances, and a difficult childhood makes children more likely to become criminals.[14]
The changing demographics of an aging population has been cited for the drop in overall crime.[15]
The introduction of the data-driven policing practice CompStat significantly reduced crimes in cities that adopted it.[16]
The quality and extent of use of security technology both increased around the time of the crime decline, after which the rate of car theft declined; this may have caused rates of other crimes to decline as well.[17]
Each state has a set of statutes enforceable within its own borders. A state has no jurisdiction outside of its borders, even though still in the United States. It must request extradition from the state in which the suspect has fled. In 2014, there were 186,873 misdemeanor suspects outside specific states jurisdiction against whom no extradition would be sought. Philadelphia has about 20,000 of these since it is near a border with four other states. Extradition is estimated to cost a few hundred dollars per case.[22]
Analysis of arrest data from California indicates that the most common causes of felony arrest are for violent offenses such as robbery and assault, property offenses such as burglary and auto theft, and drug offenses. For misdemeanors, the most common causes of arrest were traffic offenses, most notably impaired driving, drug offenses, and failure to appear in court. Other common causes of misdemeanor arrest included assault and battery and minor property offenses such as petty theft.[23]
Arrests by gender
Under questioning, Jane Toppan stated she derived a sexual thrill from patients being near death.
According to the Office of Justice Programs, crimes like burglary and vandalism have gone down during the past few years for men, and crimes like murder and robbery have gone down for women. For both genders, most of the crimes committed are done by people ages 25 and above.
Arrests by Gender (Male) (2016-2020)
Murder
Assault
Robbery
Arson
Burglary
Vandalism
2020
10,900
293,230
57,590
7,720
120,740
133,260
2019
9,600
295,040
62,930
7,100
136,420
138,620
2018
10,520
302,600
74,650
7,280
143,570
138,120
2017
10,670
298,250
80,250
7,280
161,790
145,920
2016
10,370
294,850
82,140
7,680
168,880
152,900
Arrested Offenders by gender (Female) (2016-2020)
Murder
Assault
Robbery
Arson
Burglary
Vandalism
2020
1,540
87,960
10,310
2,060
28,610
40,510
2019
1,460
90,230
11,620
1,960
35,170
41,880
2018
1,450
93,200
13,480
2,110
35,040
41,710
2017
1,530
90,670
13,800
1,830
37,480
42,430
2016
1,420
89,120
13,620
2,130
38,440
43,050
Arrests by age
Tintype of Henry McCarty, alias William H. Bonney, better known as Billy the Kid
In 2020, out of the 7,632,470 crimes documented that year, 5,721,190 of them were committed by someone who was at least 25 years of age.[24] 4,225,140 of them being committed by men and 1,496,050 being committed by women.
There is no correlation between crime rates and the number of police officers.[25]
Childhood exposure to violence
A 1997 report form the US Department of Justice states that "Most violent behavior is learned behavior. Early exposure to violence in the family may involve witnessing either violence or physical abuse.", with exposure to this violence in childhood linked to an increase in violent behaviour as an adolescent by as much as 40%.[26] Gangs and illegal markets provide high levels of exposure to violence, and violent role models and positive rewards for criminal and violent activity, such as drug distribution. Gangs are more likely to be active in poor, minority and disorganized neighborhoods; which have further effects on violent crime; as in those communities there are usually fewer or limited opportunities for employment and evidence suggests these neighbourhoods inhibit the normal progression of adolescent development.
According to the FBI Uniform Crime Reporting statistics in 2019, juveniles (0-17 years) represented 7.13% of arrests (adults: 92.87%); this is down from 12.65% in 2010, with the total number of arrests of juveniles down by 55.5%; this is explained by the drop in arrests of all ages by 21.0%.[27] When controlled for age1, the rate of juveniles arrests in 2010 was 1,296 per 100,000, and in 2019 was 586 per 100,000. Data shows that total arrests increase ten fold from ages 12-14 and then double roughly every 3 years in age from age 14 reaching a peak by age 19 that remains relatively constant until 35.[28]
Crime type and severity
People are more likely to fear and be less sympathetic toward offenders with a history of violent or sexual crime.[29] Violent criminal history is defined by the FBI as any offense, of a violent felony, including rape, homicide, aggravated assault, and robbery.[30] People tend to express more negative attitude towards violent offenders in comparison to those with a history of non-violent crime, misdemeanors, and no sexual crimes.[29]
NOTES
1. Using Office of Juvenile Justice and Delinquency Prevention (OJJDP) statistics, juvenile population in 2010 was 74,122,633, and in 2019 was 73,088,675[31]
Crime victimology
The U.S. accounts for 97% of gun-related child deaths among similar countries, despite making up only 46% of this group’s overall population.[32]Homicide victimization rate for whites and blacks, according to the US Bureau of Justice Statistics[33]Gun-related suicides and homicides in the United States[34]
In 2011, surveys indicated more than 5.8 million violent victimizations and 17.1 million property victimizations took place in the United States; according to the Bureau of Justice Statistics, each property victimization corresponded to one household, while violent victimizations is the number of victims of a violent crime.[35]
Patterns are found within the victimology of crime in the United States. Overall, people with lower incomes, those younger than 25, and non-whites were more likely to report being the victim of crime.[35]Income, gender, and age had the most dramatic effect on the chances of a person being victimized by crime, while the characteristic of race depended upon the crime being committed.[35]
In terms of gender, the BJS National Crime Victimization Survey (NCVS) published in 2019 that "the percentage of violent victimizations reported to police was higher for females (46%) than for males (36%)". This difference can largely be attributed to the reporting of simple assaults, as the percentages of violent victimizations reported to police, excluding simple assault, were similar for females (47%) and males (46%). The victim-to-population ratio of 1.0 for both males and females shows that the percentage of violent incidents involving male (49%) or female (51%) victims was equal to males' (49%) or females' (51%) share of the population.[36]
In regards to rape, the National Incident-Based Reporting System (NIBRS) indicates females are disproportionately more affected than males. According to the data collected from 2010 to 2020, women make 89% of victims of rape, while men make 11%. Perpetrators are 93% men.[37]
Concerning age, those younger than twenty-five were more likely to fall victim to crime, especially violent crime.[38] The chances of being victimized by violent crime decreased far more substantially with age than the chances of becoming the victim of property crime.[38] For example, 3.03% of crimes committed against a young person were theft, while 20% of crimes committed against an elderly person were theft.[38]
Bias motivation reports showed that of the 7,254 hate crimes reported in 2011, 47.7% (3,465) were motivated by race, with 72% (2,494) of race-motivated incidents being anti-black.[39] In addition, 20.8% (1,508) of hate crimes were motivated by sexual orientation, with 57.8% (871) of orientation-motivated incidents being anti-male homosexual.[39]
The third largest motivation factor for hate crime was religion, representing 18.2% (1,318) incidents, with 62.2% (820) of religion-motivated incidents being anti-Jewish.[39]
The likelihood of falling victim to crime relates to both demographic and geographic characteristics.[41]
In 2010, according to the UNODC, 67.5% of all homicides in the United States were perpetrated using a firearm.[42] The costliest crime in terms of total financial impact on all of its victims, and the most underreported crime is rape, in the United States.[43][44]
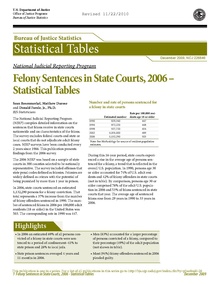
A map of U.S. states by incarceration rate under state prison jurisdiction (but excluding jail and federal prison inmates) per 100,000 populationAs of 2001, the lifetime likelihood of ever going to prison for various demographic groups, by percentagesFelony Sentences in State Courts, study by the United States Department of Justice
The United States has the highest incarceration rate in the world (which includes pre-trial detainees and sentenced prisoners).[45] As of 2009, 2.3 million people were incarcerated in the United States, including federal and state prisons and local jails, creating an incarceration rate of 793 persons per 100,000 of national population.[45] During 2011, 1.6 million people were incarcerated under the jurisdiction of federal and state authorities.[46] At the end of 2011, 492 persons per 100,000 U.S. residents were incarcerated in federal and state prisons.[46] Of the 1.6 million state and federal prisoners, nearly 1.4 million people were under state jurisdiction, while 215,000 were under federal jurisdiction.[46] Demographically, nearly 1.5 million prisoners were male, and 115,000 were female, while 581,000 prisoners were black, 516,000 were white, and 350,000 were Hispanic.[46]
Among the 1.35 million sentenced state prisoners in 2011, 725,000 people were incarcerated for violent crimes, 250,000 were incarcerated for property crimes, 237,000 people were incarcerated for drug crimes, and 150,000 were incarcerated for other offenses.[46] Of the 200,000 sentenced federal prisoners in 2011, 95,000 were incarcerated for drug crimes, 69,000 were incarcerated for public order offenses, 15,000 were incarcerated for violent crimes, and 11,000 were incarcerated for property crimes.[46]
International comparison
The manner in which the United States' crime rate compares to other countries of similar wealth and development depends on the nature of the crime used in the comparison.[47] Overall crime statistic comparisons are difficult to conduct, as the definition and categorization of crimes varies across countries. Thus an agency in a foreign country may include crimes in its annual reports which the U.S. omits, and vice versa.
However, some countries such as Canada have similar definitions of what constitutes a violent crime, and nearly all countries had the same definition of the characteristics that constitutes a homicide.[citation needed] Overall the total crime rate of the United States is higher than developed countries, specifically Europe and East Asia, with South American countries and Russia being the exceptions.[48] Some types of reported property crime in the U.S. survey as lower than in Germany or Canada, yet the homicide rate in the United States is substantially higher as is the prison population.
The Hip Sing Association building in Seattle, Washington
The difference in homicide rate between the U.S. and other high income countries has widened in recent years especially since the 30% rise in 2020 was not replicated elsewhere, and is also above many developing countries such as China, India and Turkey.[49][circular reference] In the European Union, homicides fell 32% between 2008-2019 to 3,875[50] while rising by 4,901 in the U.S. in 2020 alone,[51] leaving the U.S. with a homicide rate 7x higher. In reputable estimates of crime across the globe, the U.S. generally ranks slightly below the middle, roughly 70th lowest or 100th highest.[52][53]
The reported U.S. violent crime rate includes murder, rape and sexual assault, robbery, and assault,[54] whereas the Canadian violent crime rate includes all categories of assault, including Assault level 1 (i.e., assault not using a weapon and not resulting in serious bodily harm).[55][56] A Canadian government study concluded that direct comparison of the two countries' violent crime totals or rates was "inappropriate".[57]
France does not count minor violence such as punching or slapping as assault, whereas Austria, Germany, Finland and the United Kingdom do count such occurrences.[58]
The United Kingdom similarly has different definitions of what constitutes violent crime compared to the United States, making a direct comparison of the overall figure flawed. The FBI's Uniform Crime Reports defines a "violent crime" as one of four specific offenses: murder and non-negligent manslaughter, forcible rape, robbery, and aggravated assault. The British Home Office, by contrast, has a different definition of violent crime, including all "crimes against the person", including simple assaults, all robberies, and all "sexual offenses", as opposed to the FBI, which only counts aggravated assaults and "forcible rapes".[59]
Crime rates are necessarily altered by averaging neighborhood higher or lower local rates over a larger population which includes the entire city. Having small pockets of dense crime may increase a city's average crime rate. It is estimated that violent crime accounts for as much as $2.2 trillion by the Pacific Institute for Research and Evaluation, accounting for about 85% of the total cost of crime in the United States.[60]
Police-recorded violent crime rates per 100,000 population[61][62][63][64]
*Australian homicide statistics include murder, and manslaughter (attempted murder is excluded). Murder rate in brackets.
†Australian statistics record only sexual assault, and do not have separate statistics for rape only. Sexual assault is defined to include rape, attempted rape, aggravated sexual assault (assault with a weapon), indecent assault, penetration by objects, forced sexual activity that did not end in penetration and attempts to force a person into sexual activity; but excludes unwanted sexual touching. [67]
#Australian assault statistics calculated using per state/territory statistics, excluding Victoria as assault data is not collected.[62]
^UCR rape statistics do NOT include sexual assault, while the NCVS does, furthermore NCVS define sexual assault to include as well sexual touching with/without force, and verbal threats of rape or sexual assault, as well as rape, attempted rape, and sexual assault that isn't rape.[63][64]
Homicide
Intentional homicide rate per 100,000 residents by state, including District of Columbia, 2019[68]Homicide rate by county 2014-2020 average rate per year per 100,000 people
The historical homicide rate in the U.S. from 1900–2001
According to a 2013 report by the United Nations Office on Drugs and Crime (UNODC), between 2005 and 2012[update], the average homicide rate in the U.S. was 4.9 per 100,000 inhabitants compared to the average rate globally, which was 6.2. However, the U.S. had much higher murder rates compared to four other selected "developed countries", which all had average homicide rates of 0.8 per 100,000.[48] In 2004, there were 5.5 homicides for every 100,000 persons, roughly three times as high as Canada (1.9) and six times as high as Germany and Italy (0.9).[69][55]
In 2018, the US murder rate was 5.0 per 100,000, for a total of 15,498 murders.[70]
Country
Singapore
Iceland
Armenia
United States
Moldova
South Sudan
Panama
Homicide rate (per hundred thousand) (international methodology)[48]
0.2
0.5
1.7
5.1
5.2
12
53.1
In the United States, the number of homicides where the victim and offender relationship was undetermined has been increasing since 1999 but has not reached the levels experienced in the early 1990s. In 14% of all murders, the victim and the offender were strangers. Spouses and family members made up about 15% of all victims, about one-third of the victims were acquaintances of the assailant, and the victim and offender relationship was undetermined in over one-third of homicides. Gun involvement in homicides were gang-related homicides which increased after 1980, homicides that occurred during the commission of a felony which increased from 55% in 1985 to 77% in 2005, homicides resulting from arguments which declined to the lowest levels recorded recently, and homicides resulting from other circumstances which remained relatively constant. Because gang killing has become a normal part of inner cities, many including police hold preconceptions about the causes of death in inner cities. When a death is labeled gang-related it lowers the chances that it will be investigated and increases the chances that the perpetrator will remain at large. In addition, victims of gang killings often determine the priority a case will be given by police. Jenkins (1988) argues that many serial murder cases remain unknown to police and that cases involving Black offenders and victims are especially likely to escape official attention.[71]
According to the FBI, "When the race of the offender was known, 53.0 percent were black, 44.7 percent were white, and 2.3 percent were of other races. The race was unknown for 4,132 offenders. (Based on Expanded Homicide Data Table 3). Of the offenders for whom gender was known, 88.2 percent were male."[72] According to the U.S. Bureau of Justice Statistics, from 1980 to 2008, 84 percent of white homicide victims were killed by white offenders and 93 percent of black homicide victims were killed by black offenders.[33]
Gun homicide rate vs gun ownership rate in developed countriesCivilian guns per capita by country, Small Arms Survey 2017[73]
The United States has the highest rate of civilian gun ownership per capita.[73][74][75] According to the CDC, between 1999 and 2014 there were 185,718 homicides from use of a firearm and 291,571 suicides using a firearm.[76] The U.S. gun homicide rate in 2019 was 18 times the average rate in other developed countries.[77] Despite a significant increase in the sales of firearms since 1994, the US has seen a drop in the annual rate of homicides using a firearm from 7.0 per 100,000 population in 1993 to 3.6 per 100,000 in 2013.[78] In the ten years between 2000 and 2009, the ATF reported 37,372,713 clearances for purchase, however, in the four years between 2010 and 2013, the ATF reported 31,421,528 clearances.[79]
Property crime
Burglary rates, select industrialized countries, U.S. Bureau of Justice Statistics
According to a 2004 study by the Bureau of Justice Statistics, looking at the period from 1981 to 1999, the United States had a lower surveyed residential burglary rate in 1998 than Scotland, England, Canada, the Netherlands, and Australia. The other two countries included in the study, Sweden and Switzerland, had only slightly lower burglary rates. For the first nine years of the study period the same surveys of the public showed only Australia with rates higher than the United States. The authors noted various problems in doing the comparisons including infrequent data points. (The United States performed five surveys from 1995 to 1999 when its rate dipped below Canada's, while Canada ran a single telephone survey during that period for comparison.)[47]
Violence against children from birth to adolescence is considered a "global phenomenon that takes many forms (physical, sexual, emotional), and occurs in many settings, including the home, school, community, care, and justice systems, and over the Internet."[80]
According to a 2001 report from UNICEF, the United States has the highest rate of deaths from child abuse and neglect of any industrialized nation, at 2.4 per 100,000 children; France has 1.4, Japan 1, UK 0.9 and Germany 0.8. According to the US Department of Health, the state of Texas has the highest death rate, at 4.1 per 100,000 children, New York has 2.5, Oregon 1.5 and New Hampshire 0.4. [81]
A 2018 report from the Congressional Research Service stated, at the national level, violent crime and homicide rates have increased each year from 2014 to 2016.[82]
In 2016, data from the National Child Abuse and Neglect Data System (NCANDS) revealed that approximately 1,750 children died from either abuse or neglect; further, this is a continuing trend with an increasing 7.4% of crimes against children from 2012 to 2016 and these statistics can be compared to a rate of 2.36 children per 100,000 children in the United States general population.[83] In addition, 44.2% of these 2016 statistics are specific to physical abuse towards a child.[83]
A 2016 report from the Child Welfare Information Gateway also showed that parents account for 78% of violence against children in the United States.[84]
Human trafficking is categorized into the following three groups: (1) sex trafficking; (2) sex and labor trafficking; and (3) labor trafficking; In addition, the rate of domestic minor sex trafficking has exponentially increased over the years. Sex trafficking of children also referred to as commercial sexual exploitation of children, is categorized by the following forms: pornography, prostitution, child sex tourism, and child marriage. Profiles of traffickers and types of trafficking differ in the way victims are abducted, how they are treated, and the reason for the abduction.
According to a 2017 report from the National Human Trafficking Hotline (NHTH), out of 10,615 reported survivors of sex trafficking, 2,762 of those survivors were minors.[85]
The U.S. Department of Justice defines Commercial Sexual Exploitation of Children (CSEC) as a range of crimes and activities involving the sexual abuse or exploitation of a child for the financial benefit of any person or in exchange for anything of value (including monetary and non-monetary benefits) given or received by any person. These crimes against children, which may occur at any time or place, rob them of their childhood and are extremely detrimental to their emotional and psychological development.[86]
Types of human sex trafficking
In pimp-controlled trafficking, the pimp typically is the only trafficker involved who has full physical, psychological and emotional control over the victim. In gang-controlled trafficking, a large group of people has power over the victim, forcing the victim to take part in illegal or violent tasks for the purpose of obtaining drugs. Another form is called Familial trafficking, which differs the most from the two mentioned above because the victim is typically not abducted. Instead, the victim is forced into being sexually exploited by family members in exchange for something of monetary value, whether that's paying back debt, or obtaining drugs or money. This type of sexual exploitation tends to be the most difficult to detect, yet remains as the most prevalent form of human sex trafficking within the United States.[86]
In 2009, the Office of Juvenile Justice and Delinquency Prevention reported that the average age when children first fall victim to CSEC is between ages 12 and 14. However, this age has become increasingly younger due to exploiters' fear of contracting HIV or AIDS from older victims.[86]
In 2018, the Office of Public Affairs within the Department of Justice released a report from operation "Broken Heart" conducted by Internet Crimes Against Children (ICAC) task forces, stating that more than 2,300 suspected online child sex offenders were arrested on the following allegations:[87]
produce, distribute, receive and possess child pornography
engage in online enticement of children for sexual purposes
engage in the sex trafficking of children
travel across state lines or to foreign countries and sexually abuse children
In addition, a 2011 report by the Bureau of Justice Statistics described the characteristics of suspected human trafficking incidents, identifying roughly 95% of victims as female and over half as 17 years old or younger.
Crime rates vary in the United States depending on the type of community.[88] Within metropolitan statistical areas, both violent and property crime rates are higher than the national average; in cities located outside metropolitan areas, violent crime was lower than the national average, while property crime was higher.[88] For rural areas, both property and violent crime rates were lower than the national average.[88]
Regions
For regional comparisons, the FBI divides the United States into four regions: Northeast, Midwest, South, and West.[89] For 2019, the region with the lowest violent crime rate was the Northeast, with a rate of 292.4 per 100,000 residents, while the region with the highest violent crime rate was the West, with a rate of 413.5 per 100,000.[89] For 2019, the region with the lowest property crime rate was the Northeast, with a rate of 1,350.4 per 100,000 residents, while the region with the highest property crime rate was the West, with a rate of 2,411.7 per 100,000.[89]
Crime rates vary among U.S. states.[90] In 2019, the state with the lowest violent crime rate was Maine, with a rate of 115.2 per 100,000 residents, while the state with the highest violent crime rate was Alaska, with a rate of 867.1 per 100,000.[90] However, the District of Columbia, the U.S. capital district, had a violent crime rate of 1,049.0 per 100,000 in 2019.[90] In 2019, the state with the highest property crime rate was Louisiana, with a rate of 3,162.0 per 100,000, while the state with the lowest property crime rate was Massachusetts, with a rate of 1,179.8 per 100,000.[90] However, Puerto Rico, an unincorporated territory of the United States, had a property crime rate of 702.7 per 100,000 in 2011.[90]
According to 2022 FBI Uniform Crime Report, Louisiana's murder rate of 16.1 per 100,000 residents was the highest in the nation (states) for the 34th straight year.[91]
Crime in metropolitan statistical areas tends to be above the national average; however, wide variance exists among and within metropolitan areas.[92] Some responding jurisdictions report very low crime rates, while others have considerably higher rates; these variations are due to many factors beyond population.[92] FBI crime statistics publications strongly caution against comparison rankings of cities, counties, metropolitan statistical areas, and other reporting units without considering factors other than simply population.[92] For 2017[update], the metropolitan statistical area with the highest violent crime rate was the Memphis, Tennessee, metropolitan area, with a rate of 1168.3 per 100,000 residents, while the metropolitan statistical area with the lowest violent crime rate was Bangor, Maine, metropolitan area, with a rate of 65.8.[93]
According to Jeffrey Ross, isolated, underserved urban communities tend to perpetuate criminality and gang violence. In the United States, it is common for crime to be concentrated in a small number of economically disadvantaged areas, which may remain persistently afflicted by crime no matter which ethnic group is living there.[94]
Crime in ten largest metropolitan areas (2017)[93]
There are conflicting opinions on the number of federal crimes,[95][96] but many have argued that there has been explosive growth and it has become overwhelming.[97][98][99] In 1982, the U.S. Justice Department could not come up with a number, but estimated 3,000 crimes in the United States Code.[95][96][100] In 1998, the American Bar Association (ABA) said that it was likely much higher than 3,000, but didn't give a specific estimate.[95][96] In 2008, the Heritage Foundation published a report that put the number at a minimum of 4,450.[96] When staff for a task force of the U.S. House Judiciary Committee asked the Congressional Research Service (CRS) to update its 2008 calculation of criminal offenses in the United States Code in 2013, the CRS responded that they lack the staffing and resources to accomplish the task.[101]
^"The FBI determined that the agency's data were overreported for some parts of the metro area."[93] And some agency(s) "submitted rape data classified according to the legacy UCR definition."[93]
^"The FBI determined that the agency's data were overreported for some parts of the metro area."[93]
^"The FBI determined that the agency's data were underreported for some parts of the metro area."[93]
^When Brute Force Fails: How to Have Less Crime and Less Punishment, Princeton University Press 2009 p. 133 citing Richard Nevin, "How Lead Exposure Relates to Temoral Changes in IQ, Violent Crime and Unwed Pregnancy". Environmental Research 83, 1 (2000): 1–22.
^Lehman, Jeffrey; Phelps, Shirelle (2005). West's Encyclopedia of American Law, Volume 10 (2 ed.). Detroit: Thomson/Gale. ISBN0787663794.
^Donohue, John; Levitt, Steven (March 1, 2000). "The Impact of Legalized Abortion on Crime". Berkeley Program in Law & Economics, Working Paper Series. 2000 (2): 69. Archived from the original on March 15, 2014. Retrieved March 15, 2014.
^Wadsworth, Tim (June 2010). "Is Immigration Responsible for the Crime Drop? An Assessment of the Influence of Immigration on Changes in Violent Crime Between 1990 and 2000". Social Science Quarterly. 91 (2): 531–553. doi:10.1111/j.1540-6237.2010.00706.x.
^ ab"Table 1". FBI. Archived from the original on March 20, 2021. Retrieved April 4, 2021.
^Heath, Brad (March 13, 2014). "A license to commit crimes". USA Today. pp. 1B, 4B. Archived from the original on March 13, 2014. Retrieved March 13, 2014.
^Lofstrom, Magnus; Martin, Brandon; Goss, Justin; Hayes, Joseph; Raphael, Steven (December 2018). "New Insights into California Arrests"(PDF). Public Policy Institute of California. p. 8. Archived(PDF) from the original on May 2, 2019. Retrieved 9 August 2019.
^ abcBureau of Justice Statistics (October 2012). "Criminal Victimization, 2011"(PDF). U.S. Department of Justice. p. 1. Archived(PDF) from the original on February 19, 2013. Retrieved May 18, 2013.
^ abcdefBureau of Justice Statistics (December 2012). "Prisoners in 2011"(PDF). U.S. Department of Justice. Archived(PDF) from the original on February 14, 2013. Retrieved May 16, 2013.
^ ab"Crime in the US 2018 Table 16". Federal Bureau of Investigation Uniform Crime Reporting. Archived from the original on September 19, 2020. Retrieved 20 September 2020.
^Killias, Martin (August 1993). "Gun Ownership, Suicide and Homicide: An International Perspective"(PDF). Understanding Crime Experiences of Crime and Crime Control. Acts of the International Conference, Rome, November 18–20, 1992. Vol. Publication No. 49. United Nations Publication, Interregional Crime and Justice Research Institute (UNICRI). pp. 289–302. Sales No. E.93.III.N.2; NCJ146360. Archived(PDF) from the original on December 27, 2016. Retrieved December 27, 2016.
^Fox, Kara; Shveda, Krystina; Croker, Natalie; Chacon, Marco (November 26, 2021). "How US gun culture stacks up with the world". CNN. Archived from the original on November 26, 2021. CNN's attribution: Developed countries are defined based on the UN classification, which includes 36 countries. Source: Institute for Health Metrics and Evaluation (Global Burden of Disease 2019), Small Arms Survey (Civilian Firearm Holdings 2017)
Fragment van de Atontempel De Atontempel was gebouwd door de eigenzinnige koning Echnaton. Deze wilde de macht van de Amon-priesters breken en verliet het vijandige Thebe voor de bouw van een nieuwe stad Achetaton in het huidige Tell el-Amarna. Hij wilde de geheimzinnigheid van de Amoncultus (cfr Amon de verborgene) vervangen door de open Atoncultus. Dat werd weergegeven in de grote tempel waar er geen donkere ruimten in waren. Het was een langgerekt complex: 210 m × 32 m. H…
Kirchheim Gemeinde Amt Wachsenburg Wappen von Kirchheim Koordinaten: 50° 53′ N, 11° 1′ O50.88194444444411.019444444444250Koordinaten: 50° 52′ 55″ N, 11° 1′ 10″ O Höhe: 250 m Fläche: 21,31 km² Einwohner: 795 (31. Dez. 2018)[1] Bevölkerungsdichte: 37 Einwohner/km² Eingemeindung: 1. Januar 2019 Postleitzahl: 99334 Vorwahl: 036200, 0361 (Bechstedt-Wagd) Kirchheim (anhörenⓘ/?) ist ein Ortsteil d…
Pertempuran KoronelBagian dari the Perang Dunia ISkuadron Jerman meninggalkan Valparaiso pada 3 November 1914 setelah pertempuran, SMS Scharnhorst dan Gneisenau di depan, dan SMS Nürnberg membuntuti mereka. Ditengah kejauhan, kapal-kapal penjelajah milik Chili Esmeralda, O'Higgins and Blanco Encalada, dan kapal tempur Capitán Prat.Tanggal1 November 1914LokasiSamudera Pasifik, lepas pantai Koronel, ChiliHasil Kemenangan JermanPihak terlibat Britania Raya German EmpireTokoh…
1999 Ceuta Assembly election ← 1995 13 Jun 1999 2003 → All 25 seats in the Assembly of Ceuta13 seats needed for a majorityOpinion pollsRegistered54,609 7.2%Turnout33,505 (61.4%)4.7 pp First party Second party Third party Leader Antonio Sampietro[1] Juan Jesús Vivas Party GIL PP PDSC Leader since October 1999 Last election Did not contest 9 seats, 30.9% 1 seats, 5.0% Seats won 12 8 3 Seat change 12 1 2 Popular vote 12,721 …
Zelaya Localidad rural Otros nombres: El Pueblo de la Virgen ZelayaLocalización de Zelaya en Provincia de Buenos AiresCoordenadas 34°22′22″S 58°52′12″O / -34.372777777778, -58.87Idioma oficial EspañolEntidad Localidad rural • País Argentina • Provincia Buenos Aires Provincia • Partido PilarIntendente Federico Achával (Frente Unión por la Patria, Partido Justicialista)Subdivisiones Cuartel Décimo del Partido del PilarEventos histór…
دوري الدرجة الأولى الأرجنتيني 1925 تفاصيل الموسم دوري الدرجة الأولى الأرجنتيني البلد الأرجنتين التاريخ بداية:5 أبريل 1925 البطل هوراكان عدد المشاركين 23 دوري الدرجة الأولى الأرجنتيني 1924 دوري الدرجة الأولى الأرجنتيني 1926 تعديل مصدري - تعديل دوري الدرجة…
Potret Jean Moulin Monumen untuk Jean Moulin di Aix-les-Bains Jean Pierre Moulin (bahasa Prancis: [ʒɑ̃ mu.lɛ̃]., lahir 20 Juni 1899 di Béziers[1] dan meninggal 8 Juli 1943 di dekat Metz, adalah seorang pejabat senior dan pemberontak Prancis. Prefek Aveyron kemudian Eure-et-Loir, menolak pendudukan Jerman di Prancis selama Perang Dunia II, pada September 1941 ia bergabung dengan Pasukan Kemerdekaan Prancis di London melalui Spanyol dan Portugal. Dia diterima oleh Charles de Gau…
2014 Crown Royal Presents the John Wayne Walding 400 at the Brickyard Race details[1][2][3][4][5][6][7][8][9] Race 20 of 36 in the 2014 NASCAR Sprint Cup Series The 2014 Brickyard 400 program cover, celebrating the 20th Brickyard 400.Date July 27, 2014 (2014-07-27)Location Indianapolis Motor Speedway, Speedway, IndianaCourse Permanent racing facility2.5 mi (4.023 km)Distance 160 laps, 400 mi (643.737 km)Weathe…
Below are the full rosters, including the coaching staffs, of all 30 Major League Baseball teams. All teams are allowed up to 40 players on their roster, which doesn't include players on the 60-day injured list. American League American League East Baltimore Orioles 2024 spring training rostervte 40-man roster Non-roster invitees Coaches/Other Pitchers 45 Keegan Akin 43 Bryan Baker 53 Mike Baumann 74 Félix Bautista 39 Kyle Bradish 78 Yennier Canó 54 Danny Coulombe 24 DL Hall 19 Cole Irvin 56 S…
British Lions & Wales international rugby union footballer Rugby playerRex WillisWillis in New Zealand in 1950Birth nameWilliam Rex WillisDate of birth(1924-10-25)25 October 1924Place of birthYstrad, Rhondda, WalesDate of death19 January 2000(2000-01-19) (aged 75)SchoolThe Cathedral School, LlandaffPangbourne Nautical CollegeOccupation(s)businessmanRugby union careerPosition(s) Scrum halfAmateur team(s)Years Team Apps (Points)??-19561951–1954 Llandaff RFCCardiff RFCBarbarian F.C.[…
2nd TVyNovelas AwardsDate1984LocationMexico City, MexicoMost awardsEl maleficio (5)Most nominationsEl maleficio (11)Television/radio coverageNetworkCanal de las estrellas ← 1st · TVyNovelas Awards · 3rd → The 2nd TVyNovelas Awards were an academy of special awards to the best soap operas and TV shows. The awards ceremony took place in 1984 in Mexico City.[1] El maleficio won 5 awards, the most for the evening. Other winners Bodas de odio won 4 awards, in…
نظام الهاتف المحمول المتطور (بالإنجليزية: Advanced Mobile Phone System) اختصاراً AMPS، هو نظام هواتف محمولة ذا إشارة تماثلية طُوّر من قبل مختبرات بل، وقدم رسمياً في الأمريكتين عام 1983.[1][2] وكان النظام الرئيسي للهواتف المحمولة في أمريكا الشمالية (ومحليات أخرى)، خلال ثمانينات القرن …
Mexican Latin pop-rock group This article is about the Mexican pop group. For other uses, see RBD (disambiguation). RBDRBD in 2023.Background informationOriginMexico City, MexicoGenresLatin poppop rockpopdance-popR&BReggaetónDiscographyRBD discographyYears active2004–20092020-presentLabelsEMICapitolVirginUniversalMembers Anahí Dulce María Maite Perroni Christopher von Uckermann Christian Chávez Past members Alfonso Herrera Websitesoyrebelde.world RBD is a Mexican Latin pop group that g…
Simulation video game 2009 video gameThe Idolmaster SPCover art of The Idolmaster SP: Perfect Sun. From top to bottom: Makoto, Haruka and Yayoi.Developer(s)Namco Bandai GamesPublisher(s)Namco Bandai GamesDirector(s)Akihiro IshiharaProducer(s)Yōzō SakagamiWriter(s)Tomoyo TakahashiEmi TanakaSeriesThe IdolmasterPlatform(s)PlayStation PortableReleaseJP: February 19, 2009Genre(s)Raising simulation, RhythmMode(s)Single-player, multiplayer The Idolmaster SP (アイドルマスターエスピー, Aido…
Video game franchise This article is about the franchise. For the original video game, see Angry Birds (video game). Telepod redirects here. For the fictional teleportation technology, see The Fly (1986 film). Angry BirdsLogo used since 2015Created byJaakko IisaloOriginal workAngry Birds (2009)OwnerRovio Entertainment (2009–present)Sega (2023–present)Years2009–presentPrint publicationsBook(s) Cook books Angry Birds: Bad Piggies Egg Recipes Documentary books Angry Birds: Hatching a Universe…
Men's tanding 60 kg at the 2018 Asian GamesVenuePadepokan Pencak SilatDates23–29 August 2018Competitors9 from 9 nationsMedalists Hanifan Yudani Kusumah Indonesia Nguyễn Thái Linh Vietnam Adilan Chemaeng Thailand Mohd Hazim Amzad Malaysia Pencak silat at the2018 Asian GamesSeniTunggalmenwomenGandamenwomenRegumenwomenTanding55 kgmenwomen60 kgmenwomen65 kgmenwomen70 kgmen75 kgmen90 kgmen95 kgmenvte Main ar…
2015 singleMondai GirlLimited Edition CoverSinglefrom the album KPP Best B-sideKISEKAEMy RoomReleasedMarch 18, 2015RecordedJuly - December 2014GenreJ-popLength31:08LabelUnbordeSongwriter(s)Yasutaka NakataProducer(s)Yasutaka Nakatasingles chronology Kira Kira Killer (2014) Mondai Girl (2015) Crazy Party Night ~Pumpkin no Gyakushū~ (2015) Music videoMondai Girl on YouTube Mondai Girl (もんだいガール, Mondai Gāru, lit. Problem Girl) is the tenth physical single by Japanese singer Kyary Pam…
Part of Timurid-Uzbek wars This article does not cite any sources. Please help improve this article by adding citations to reliable sources. Unsourced material may be challenged and removed.Find sources: Battle of Ab Darrah Pass – news · newspapers · books · scholar · JSTOR (February 2022) (Learn how and when to remove this template message) Battle of Ab Darrah PassPart of Timurid-Uzbek WarsOld castle in HisarDate1511 CELocationAb Darrah Pass, Afghanistan…
Герман СтефанссонНародився 25 грудня 1968(1968-12-25) (54 роки)Рейк'явік, ІсландіяКраїна ІсландіяДіяльність письменник, композиторЗнання мов ісландська Герман Стефансон (нар. 25 липня 1968, Рейк'явік, Ісландія) — ісландський письменник, музикант і поет. Його роман «Oblivion» був н…
Bar and restaurant in Seattle, Washington, U.S. Central SaloonRestaurant informationStreet address207 1st Avenue SouthCitySeattleStateWashingtonPostal/ZIP Code98104CountryUnited StatesCoordinates47°36′2.2″N 122°20′4″W / 47.600611°N 122.33444°W / 47.600611; -122.33444 Central Saloon is a bar, restaurant and music venue in Seattle, in the U.S. state of Washington. Established in 1892, the bar is among the city's oldest.[1][2] The bar is located i…
American author and lawyer Richard Henry Dana Jr.Richard Henry Dana photographed by Asa B. Eaton, c. 1868.United States Attorney for the District of MassachusettsIn office1861–1866PresidentAbraham LincolnPreceded byCharles L. WoodburySucceeded byGeorge Stillman Hillard Personal detailsBorn(1815-08-01)August 1, 1815Cambridge, Massachusetts, U.S.DiedJanuary 6, 1882(1882-01-06) (aged 66)Rome, ItalyPolitical partyFree SoilRepublicanOther politicalaffiliationsIndependent Republican (1868)Signa…
26th Mechanized CorpsActive1941CountrySoviet UnionBranchRed ArmyTypeMechanized corpsCommandersNotablecommandersNikolai KirichenkoMilitary unit The 26th Mechanized Corps (Military Unit Number 7476) was a Mechanized corps of the Red Army.[1] The mechanized corps of the Red Army were reorganized after Operation Barbarossa, the German invasion of the Soviet Union. The corps was reorganized and disbanded before it saw action. History Formation A destroyed T-26 of the type used by the corps Th…
В Википедии есть статьи о других людях с такой фамилией, см. Воронин; Воронин, Владимир. Владимир Николаевич ВоронинVladimir Voronin Воронин в 2014 году Депутат Парламента Республики Молдова III, V—IX, XI созывов с 23 июля 202122 апреля 2009 — 9 марта 201917 марта — 8 апреля 20059 апреля 1998 — 18 апреля…
artikel ini tidak memiliki pranala ke artikel lain. Tidak ada alasan yang diberikan. Bantu kami untuk mengembangkannya dengan memberikan pranala ke artikel lain secukupnya. (Pelajari cara dan kapan saatnya untuk menghapus pesan templat ini) Artikel ini sebatang kara, artinya tidak ada artikel lain yang memiliki pranala balik ke halaman ini.Bantulah menambah pranala ke artikel ini dari artikel yang berhubungan atau coba peralatan pencari pranala.Tag ini diberikan pada Oktober 2016. Sekolah pintar…


")

")


")


")

